In the world of modern software development, performance is not just a feature; it’s a fundamental requirement. For applications built with Java, especially those deployed as Java Microservices in cloud environments like Kubernetes, optimization is the key to scalability, cost-efficiency, and a superior user experience. While the Java Virtual Machine (JVM) is a marvel of engineering with its Just-In-Time (JIT) compilation and advanced Garbage Collection, writing truly high-performance Java Backend systems requires a deeper understanding of the platform’s nuances.
This article provides a comprehensive guide to Java Optimization, covering everything from fundamental JVM tuning to advanced asynchronous programming patterns. We’ll explore practical, code-driven examples relevant for modern Java versions like Java 17 and Java 21, and discuss tools and best practices that empower developers to build faster, more resilient applications. Whether you’re working with Java Spring Boot, Jakarta EE, or any other Java Frameworks, these principles will help you unlock the full potential of your Java code.
Understanding the Core: JVM Tuning and Garbage Collection
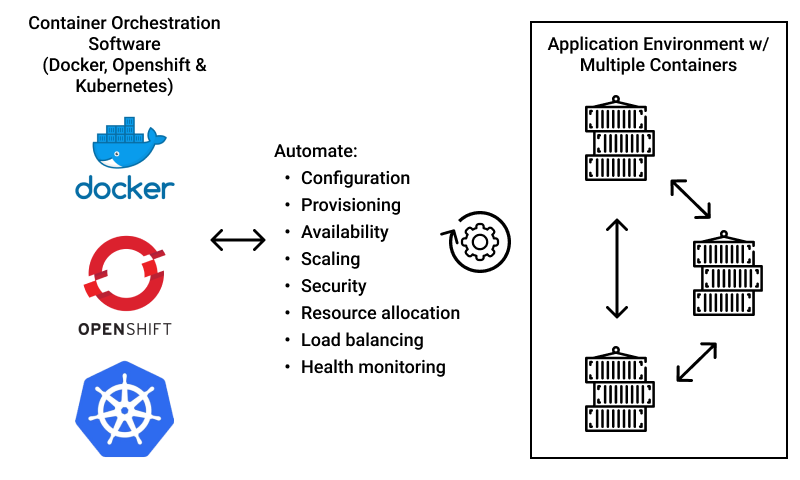
Before you even write a single line of optimized code, the first layer of performance tuning begins with the Java Virtual Machine (JVM) itself. The JVM is the runtime engine that executes your Java bytecode, and its configuration can have a massive impact on your application’s memory usage, latency, and throughput. This is especially critical in containerized environments like Docker and Kubernetes, where resource limits are strictly enforced.
Heap Size Configuration
The most common JVM tuning parameters are related to heap size. The heap is the memory area where your application’s objects live. Misconfiguring it can lead to poor performance or OutOfMemoryError exceptions.
- -Xms<size>: Sets the initial heap size.
- -Xmx<size>: Sets the maximum heap size.
In production server environments, a common practice is to set the initial and maximum heap sizes to the same value (-Xms2g -Xmx2g). This prevents the JVM from having to pause the application to resize the heap, which can cause latency spikes. Since Java 10, the JVM has become more container-aware, automatically detecting memory limits set by container orchestrators like Kubernetes. However, it’s still a best practice to explicitly set these flags for predictable performance.
Choosing the Right Garbage Collector
Garbage Collection (GC) is the process of reclaiming memory occupied by objects that are no longer in use. The JVM provides several GC algorithms, each with different trade-offs. The choice of GC can significantly affect application pause times and overall performance.
- G1 GC (Garbage-First): The default collector since Java 9. It’s a great all-around choice that balances throughput and latency, making it suitable for most modern Java Enterprise applications with large heaps.
- ZGC (Z Garbage Collector): Introduced as experimental in Java 11 and production-ready in Java 15. ZGC is designed for extremely low-latency applications, offering pause times that do not exceed a few milliseconds, regardless of heap size. It’s an excellent choice for latency-sensitive Java REST API services.
- Shenandoah GC: Another low-pause-time collector that performs more of its work concurrently with the application threads. It’s a strong contender for applications requiring responsive user interfaces or strict service level agreements (SLAs).
With modern Java versions like Java 17 and Java 21, G1GC has been significantly improved, and both ZGC and Shenandoah are production-ready. For a typical Spring Boot microservice, G1GC is often sufficient. However, for services where low latency is paramount, experimenting with ZGC (-XX:+UseZGC) is highly recommended.
Writing Performant Code: Micro-Optimizations That Matter
While JVM tuning provides a solid foundation, the application code itself is where most performance bottlenecks hide. Writing efficient code is about understanding how Java works under the hood and making conscious decisions to avoid common performance traps. This is a key aspect of Clean Code Java and follows the principles of effective Java Architecture.
The Perils of String Concatenation in Loops
A classic example of a common performance pitfall is string concatenation using the + operator inside a loop. In Java, String objects are immutable. This means that every time you use the + operator to concatenate strings, a new String object is created. In a loop, this leads to the creation of many intermediate objects, putting unnecessary pressure on the garbage collector.
The correct approach is to use StringBuilder, which is a mutable sequence of characters.
public class StringOptimization {

    // Inefficient: Creates many intermediate String objects
    public String inefficientConcatenation(String[] words) {
        String sentence = "";
        for (String word : words) {
            sentence = sentence + word;
        }
        return sentence;
    }

    // Efficient: Uses a mutable StringBuilder
    public String efficientConcatenation(String[] words) {
        StringBuilder builder = new StringBuilder();
        for (String word : words) {
            builder.append(word);
        }
        return builder.toString();
    }
}
Efficient Use of Java Collections
The Java Collections framework is powerful, but using the right collection for the job is crucial. For example, if you need fast key-based lookups, a HashMap is far superior to an ArrayList that you have to iterate through. Additionally, pre-sizing your collections can prevent costly resizing operations.
If you know roughly how many elements a collection will hold, initialize it with an appropriate capacity.
import java.util.ArrayList;
import java.util.List;

public class CollectionOptimization {

    public void processItems() {
        int expectedItemCount = 10000;

        // Inefficient: The list will resize multiple times as elements are added.
        // Each resize involves creating a new, larger array and copying elements.
        List<String> inefficientList = new ArrayList<>();
        for (int i = 0; i < expectedItemCount; i++) {
            inefficientList.add("Item " + i);
        }

        // Efficient: The list is initialized with the required capacity upfront.
        // This avoids the overhead of repeated array copying.
        List<String> efficientList = new ArrayList<>(expectedItemCount);
        for (int i = 0; i < expectedItemCount; i++) {
            efficientList.add("Item " + i);
        }
    }
}
Embracing Asynchrony and Parallelism for Scalability
In the era of Java Microservices and cloud-native applications, scalability is paramount. A single service might need to handle thousands of concurrent requests. Traditional synchronous, blocking I/O models are often insufficient. Modern Java Development relies heavily on asynchronous and parallel programming to build responsive and resilient systems.
Asynchronous Programming with CompletableFuture

Introduced in Java 8, CompletableFuture is a cornerstone of modern Java Async programming. It allows you to write non-blocking code that can perform long-running operations (like network calls or database queries) without tying up a thread. This is especially important in frameworks like Spring Boot for building scalable Java REST APIs.
Imagine a service that needs to fetch data from two different external APIs and then combine the results. A synchronous approach would be slow, as it would wait for the first API call to complete before starting the second.
import java.util.concurrent.CompletableFuture;
import java.util.concurrent.ExecutorService;
import java.util.concurrent.Executors;
import java.util.concurrent.TimeUnit;

public class AsyncApiAggregator {

    private final ExecutorService customExecutor = Executors.newFixedThreadPool(10);

    // Simulates a slow network call
    private String callExternalApi(String apiName) {
        try {
            TimeUnit.SECONDS.sleep(2); // Simulate 2-second latency
        } catch (InterruptedException e) {
            Thread.currentThread().interrupt();
        }
        return "Data from " + apiName;
    }

    public CompletableFuture<String> fetchAndCombineData() {
        // Start both API calls asynchronously on a custom thread pool
        CompletableFuture<String> userFuture = CompletableFuture.supplyAsync(
            () -> callExternalApi("User API"), customExecutor);

        CompletableFuture<String> orderFuture = CompletableFuture.supplyAsync(
            () -> callExternalApi("Order API"), customExecutor);

        // Combine the results when both are complete, without blocking
        return userFuture.thenCombine(orderFuture, (userData, orderData) -> {
            return "Combined: [" + userData + "] and [" + orderData + "]";
        });
    }

    public static void main(String[] args) throws Exception {
        AsyncApiAggregator aggregator = new AsyncApiAggregator();
        long start = System.currentTimeMillis();

        CompletableFuture<String> resultFuture = aggregator.fetchAndCombineData();
        String result = resultFuture.join(); // Block for the final result in main

        long duration = System.currentTimeMillis() - start;
        System.out.println(result);
        System.out.println("Total time taken: " + duration + "ms"); // Will be ~2000ms, not 4000ms

        aggregator.customExecutor.shutdown();
    }
}
In this example, both API calls run in parallel. The total execution time is determined by the longest-running call (~2 seconds), not the sum of both (~4 seconds), dramatically improving the responsiveness of your service.
Parallel Processing with Java Streams
For CPU-bound tasks, Java Streams, another feature from Java 8, provide a simple way to leverage multi-core processors. By simply calling the .parallel() method on a stream, you can instruct the JVM to process the elements in parallel using the common Fork-Join pool.
However, parallelism is not a silver bullet. The overhead of coordinating threads can sometimes make a parallel stream slower than a sequential one for small datasets or tasks with minimal processing. Always measure the performance impact. This is a key principle in Functional Java programming.
Best Practices and The Art of Profiling
The golden rule of Java Optimization is: **”Measure, don’t guess.”** Making changes based on assumptions is a common path to introducing new bugs without any real performance gain. This is where profiling tools become indispensable.
Tools of the Trade
- VisualVM: Bundled with the JDK, VisualVM is a great starting point for monitoring CPU, memory, and thread activity in your Java application.
- JProfiler & YourKit: These are commercial, feature-rich profilers that provide deep insights into method call times, memory allocations, and concurrency issues. They are invaluable for pinpointing the exact location of performance bottlenecks.
- Java Microbenchmark Harness (JMH): When you need to measure the performance of a small piece of code (a microbenchmark), JMH is the standard tool. It helps you avoid common benchmarking pitfalls like dead code elimination and JIT compiler optimizations that can skew results.
Key Best Practices
- Profile First: Before optimizing, use a profiler to identify the actual bottlenecks. The 80/20 rule often applies: 80% of the time is spent in 20% of the code. Focus your efforts there.
- Understand Your Algorithms: A better algorithm will always beat micro-optimizations. Choosing the right data structure and algorithm (e.g., O(log n) vs. O(n^2)) has the most significant impact.
- Avoid Premature Optimization: Writing overly complex code for a minor, unproven performance gain makes the code harder to maintain. Write clean, simple code first, then optimize the proven hot spots.
- Leverage Modern Java Features: Keep up-to-date with new releases. Features in Java 17 and Java 21, like improvements to Garbage Collectors and new APIs, often provide performance benefits out of the box.
- Consider Caching: For frequently accessed, expensive-to-compute data, implement a caching strategy. This can be as simple as an in-memory
ConcurrentHashMapor a sophisticated distributed cache like Redis.
Conclusion: A Continuous Journey
Java Performance tuning is not a one-time task but a continuous process of measurement, analysis, and refinement. It requires a holistic approach that considers everything from the underlying JVM Tuning and Garbage Collection settings to the high-level Java Architecture and asynchronous patterns in your application code.
By starting with a properly configured JVM, writing efficient and mindful code, and embracing modern concurrency models like CompletableFuture and parallel streams, you can build highly scalable and performant Java applications. Always remember to ground your optimization efforts in solid data from profiling tools. By following these principles, you can ensure your applications running on platforms from bare metal to Kubernetes Java deployments are fast, efficient, and ready to meet the demands of a modern, cloud-native world.