In the world of modern software development, performance is not just a feature; it’s a fundamental requirement. From scalable Java microservices and high-throughput Java REST APIs to responsive Java web development, the speed and efficiency of your application can directly impact user experience, operational costs, and business success. While Java has a reputation for being robust and platform-independent, achieving peak performance requires a deep understanding of the Java Virtual Machine (JVM), modern language features, and strategic optimization techniques.
The Java ecosystem is evolving at a rapid pace. With Long-Term Support (LTS) releases like Java 17 and Java 21, developers now have access to powerful new tools and paradigms, including virtual threads from Project Loom, advanced garbage collectors, and enhanced API capabilities. This article serves as a comprehensive guide to Java optimization, covering everything from JVM tuning and garbage collection to code-level best practices and advanced strategies for cloud-native environments. Whether you’re building a complex Java Enterprise application with Jakarta EE or a lightweight service with Spring Boot, these principles will help you write cleaner, faster, and more efficient code.
The Foundation: Understanding the JVM and Garbage Collection
Before you can optimize your code, you must first understand the environment it runs in. The Java Virtual Machine (JVM) is a masterpiece of engineering that handles memory management, code execution, and runtime optimization. Mastering its core components is the first step toward high-performance Java applications.
The JVM HotSpot Engine and JIT Compilation
The JVM doesn’t interpret Java bytecode line by line. Instead, the HotSpot engine uses a technique called Just-In-Time (JIT) compilation. Initially, code is interpreted, which is slow. As the JVM identifies “hot spots”—code that is executed frequently—it compiles them into highly optimized native machine code. This process, known as tiered compilation, is why Java applications often have a “warm-up” period. Performance gradually improves as the JIT compiler does its work. Understanding this is crucial for accurate benchmarking; you must allow the application to warm up before measuring its peak performance.
Demystifying Garbage Collection (GC)
Garbage Collection is Java’s automatic memory management system, which reclaims memory occupied by objects that are no longer in use. A poorly configured GC can lead to long pauses, freezing your application and causing high latency. Modern Java offers several advanced garbage collectors:
- G1 GC (Garbage-First): The default GC since Java 9. It’s a balanced collector designed for multi-processor machines with large memory heaps, aiming for predictable pause times.
- ZGC (Z Garbage Collector): A scalable, low-latency collector designed for heaps ranging from a few gigabytes to many terabytes. Its pause times don’t increase with heap size, making it ideal for services that require consistent low latency.
- Shenandoah GC: Similar to ZGC, it aims to reduce pause times by doing more garbage collection work concurrently with the application threads.
Choosing and tuning the right GC is a critical aspect of Java performance tuning. You can specify which GC to use and set initial parameters via JVM flags when starting your application.
# Command to run a Spring Boot JAR with ZGC and specific memory settings
# This is ideal for a service that needs very low latency and has a large heap.

java -Xms2g -Xmx2g \
     -XX:+UseZGC \
     -XX:MaxGCPauseMillis=10 \
     -jar my-application.jar
Code-Level Optimizations: Writing Performant Java
While JVM tuning is powerful, the most significant performance gains often come from writing efficient code. Modern Java features, particularly in Java Streams and concurrency, provide ample opportunities for optimization.
The Power and Pitfalls of Java Streams
Java Streams offer a functional and expressive way to process collections. However, their convenience can sometimes hide performance traps. The order of operations in a stream pipeline matters significantly. Always apply operations that reduce the size of the stream (like filter) before operations that transform its elements (like map).
Consider this example where we process a list of products. The inefficient version maps every object before filtering, creating unnecessary objects. The optimized version filters first, reducing the workload for subsequent operations.
import java.util.List;
import java.util.stream.Collectors;

public class StreamOptimization {

    record Product(String sku, String category, double price) {}
    record ProductDto(String sku, double price) {}

    // Inefficient: Maps all products to DTOs, then filters.
    // Creates many unnecessary ProductDto objects.
    public List<ProductDto> getExpensiveElectronicsInefficient(List<Product> products) {
        return products.stream()
                .map(p -> new ProductDto(p.sku(), p.price())) // Expensive mapping happens first
                .filter(dto -> dto.price() > 1000.0)
                .collect(Collectors.toList());
    }

    // Optimized: Filters first, then maps only the relevant products.
    // Significantly reduces object creation.
    public List<ProductDto> getExpensiveElectronicsOptimized(List<Product> products) {
        return products.stream()
                .filter(p -> "Electronics".equals(p.category())) // Filter on the original object
                .filter(p -> p.price() > 1000.0) // Reduce the stream size early
                .map(p -> new ProductDto(p.sku(), p.price())) // Map only the filtered items
                .collect(Collectors.toList());
    }
}
While parallel streams (.parallelStream()) can boost performance for large datasets and CPU-bound tasks, they are not a silver bullet. They use a common ForkJoinPool, and misusing them for I/O-bound tasks or small datasets can actually degrade performance due to thread management overhead.
Effective Concurrency with Virtual Threads (Project Loom)
Introduced as a final feature in Java 21, virtual threads are a revolutionary change for Java concurrency. Traditional “platform threads” are mapped one-to-one to operating system threads, which are a scarce resource. Virtual threads, however, are lightweight threads managed by the JVM, allowing you to have millions of them. This makes them perfect for I/O-bound tasks, such as handling thousands of concurrent API requests or database calls.
The following example demonstrates how a web server could handle requests. The traditional approach uses a fixed-size thread pool, which becomes a bottleneck under high load. The virtual thread approach creates a new virtual thread for each task, scaling effortlessly.
import java.util.concurrent.ExecutorService;
import java.util.concurrent.Executors;
import java.util.stream.IntStream;

public class VirtualThreadsDemo {

    // Simulates a time-consuming I/O operation like a database call or external API request
    private static void handleRequest(int i) {
        System.out.println("Handling request " + i + " on thread: " + Thread.currentThread());
        try {
            Thread.sleep(1000); // Simulate I/O wait
        } catch (InterruptedException e) {
            Thread.currentThread().interrupt();
        }
    }

    public static void main(String[] args) throws InterruptedException {
        // --- Traditional Approach: Fixed Platform Thread Pool ---
        // Limited by the number of platform threads (e.g., 200).
        // If 1000 requests come in, many will have to wait.
        System.out.println("--- Starting with Platform Thread Pool ---");
        try (ExecutorService executor = Executors.newFixedThreadPool(200)) {
            IntStream.range(0, 1000).forEach(i -> {
                executor.submit(() -> handleRequest(i));
            });
        }

        Thread.sleep(2000); // Wait for some tasks to complete

        // --- Modern Approach: Virtual Threads ---
        // Creates a new virtual thread for each task. Lightweight and scalable.
        // Can easily handle thousands of concurrent I/O-bound tasks.
        System.out.println("\n--- Starting with Virtual Threads ---");
        try (ExecutorService executor = Executors.newVirtualThreadPerTaskExecutor()) {
            IntStream.range(0, 1000).forEach(i -> {
                executor.submit(() -> handleRequest(i));
            });
        }
    }
}
For modern Java backend development, especially with frameworks like Spring Boot, leveraging virtual threads can dramatically improve throughput and simplify your asynchronous code, replacing complex `CompletableFuture` chains in many scenarios.
Advanced Optimization: Profiling and Cloud-Native Strategies
Once you’ve applied code-level best practices, the next step is to use advanced tools and techniques to find and eliminate bottlenecks, especially in specialized environments like the cloud.


Profiling: Your Performance Compass
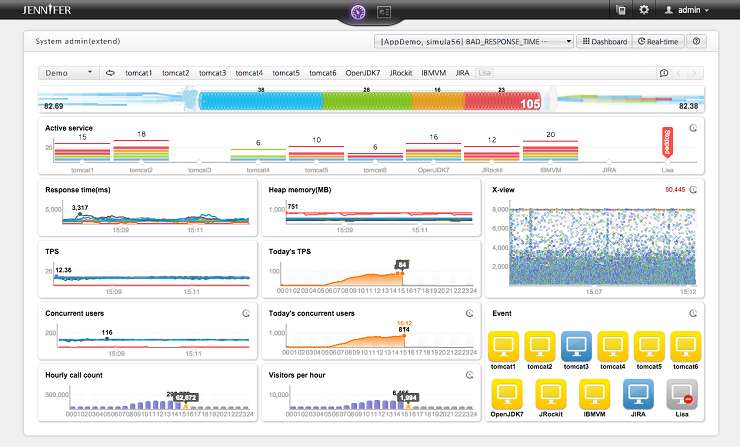
The golden rule of optimization is: **”Do not guess. Measure.”** A profiler is a tool that analyzes your application at runtime to identify performance issues. It helps you find CPU hotspots (methods where your app spends the most time), memory leaks (objects that are never garbage collected), and thread contention issues. Popular Java profilers include:
- VisualVM: Included with the JDK, it’s a great starting point for CPU and memory profiling.
- JProfiler & YourKit: Commercial tools with advanced features like database call analysis, non-intrusive profiling, and excellent user interfaces.
Profiling should be the first step in any serious optimization effort. It provides the data needed to focus your efforts where they will have the most impact.
Optimizing for the Cloud: AWS SnapStart and Priming
In serverless environments like AWS Lambda, Java applications have historically suffered from slow “cold starts”—the time it takes to initialize the JVM and the application framework. AWS SnapStart is a game-changing feature for Java on Lambda that dramatically reduces cold start times.
SnapStart works by taking a snapshot of the memory and disk state of an already-initialized function and caching it. When a new execution environment is needed, it resumes from this snapshot instead of starting from scratch. To make this even more effective, you can use a technique called “priming.” This involves running code during the initialization phase (before the snapshot is taken) to warm up your application. For example, you can establish database connections, pre-populate caches, or perform one-time computations.
Here’s a conceptual example of a priming hook in a Spring Boot application intended for AWS Lambda with SnapStart.
import org.crac.Core;
import org.crac.Resource;
import org.springframework.context.ApplicationListener;
import org.springframework.context.event.ContextRefreshedEvent;
import org.springframework.stereotype.Component;

// This component uses the CRaC (Coordinated Restore at Checkpoint) API,
// which is what AWS SnapStart is based on.
@Component
public class PrimingService implements ApplicationListener<ContextRefreshedEvent>, Resource {

    private final MyDatabaseService databaseService;

    public PrimingService(MyDatabaseService databaseService) {
        this.databaseService = databaseService;
        // Register this resource with the CRaC context to get before/after checkpoint hooks
        Core.getGlobalContext().register(this);
    }

    // This method is called when the Spring context is fully initialized.
    // This is where we perform our priming.
    @Override
    public void onApplicationEvent(ContextRefreshedEvent event) {
        System.out.println("Priming application resources...");
        // Prime the database connection pool by making a simple, fast query.
        databaseService.warmUpConnection();
        // Pre-load a read-only cache.
        // someCache.loadAll();
        System.out.println("Priming complete. Application is ready for snapshot.");
    }

    // CRaC hook: Called just before the snapshot is taken by SnapStart.
    @Override
    public void beforeCheckpoint(org.crac.Context<? extends Resource> context) throws Exception {
        System.out.println("Before checkpoint: cleaning up resources if needed.");
    }

    // CRaC hook: Called after the function is restored from the snapshot.
    @Override
    public void afterRestore(org.crac.Context<? extends Resource> context) throws Exception {
        System.out.println("After restore: re-establishing connections if needed.");
    }
}

// Dummy service for demonstration
@Component
class MyDatabaseService {
    public void warmUpConnection() {
        System.out.println("Warming up database connection pool...");
        // In a real app, this would execute a query like 'SELECT 1'
    }
}
By using SnapStart with priming, you can achieve warm-start performance for nearly every invocation, making Java a highly competitive choice for serverless functions.
Best Practices and Common Pitfalls
Beyond specific techniques, a set of guiding principles can help you maintain a high-performance application over time.
General Best Practices
- Choose the Right Data Structure: Understand the performance characteristics of Java Collections. Use
ArrayListfor fast index-based access andLinkedListfor fast insertions/deletions in the middle. UseHashMapfor fast key-based lookups. - Minimize Object Creation: Avoid creating objects in tight loops. Excessive object creation, or “churn,” puts pressure on the garbage collector.
- Use Caching: For frequently accessed data that doesn’t change often, implement a caching layer to avoid expensive computations or I/O operations.
- String Concatenation: In loops, prefer
StringBuilderover the+operator for concatenating strings to avoid creating numerous intermediate String objects.
Common Pitfalls to Avoid
- Premature Optimization: Don’t optimize code that isn’t a bottleneck. As Donald Knuth said, “Premature optimization is the root of all evil.” Use a profiler to find the real problems first.
- Ignoring Database Performance: Often, the biggest bottleneck isn’t in your Java code but in slow database queries. Analyze query plans and ensure proper indexing. Tools like Hibernate and JPA can sometimes generate inefficient queries if not used carefully.
- Misusing Concurrency: Using parallel streams or threads incorrectly can lead to race conditions, deadlocks, and performance degradation. Always be deliberate about your concurrency strategy.
Conclusion
Java optimization is a multifaceted discipline that spans the entire software stack, from low-level JVM tuning to high-level application architecture. The journey to a high-performance application begins with a solid understanding of the JVM and garbage collection. It continues with writing clean, efficient code by leveraging modern Java features like optimized Streams and virtual threads. Finally, it involves a continuous cycle of measuring, profiling, and refining, especially when deploying to specialized environments like the cloud.
By embracing the tools and techniques discussed—from choosing the right garbage collector and profiling your code to leveraging cloud-native features like AWS SnapStart—you can build Java applications that are not only robust and scalable but also incredibly fast. As the Java platform continues to evolve with projects like Loom and Leyden, staying current with these advancements will be key to unlocking the next level of performance in your Java development journey.
