Last updated: May 09, 2026
A Micrometer tag becomes an OTLP per-DataPoint attribute by default. Only entries set via OtlpConfig.resourceAttributes, the OTEL_RESOURCE_ATTRIBUTES env var, or OTEL_SERVICE_NAME become Resource-level attributes. commonTags() never crosses that boundary — no matter how it is registered. The translation runs precedence env-vars → config → registry tags, and the difference shows up as cardinality cost on every metric stream and as broken trace-to-metric correlation in Grafana, Tempo, or Dynatrace.
- Micrometer tags map to
NumberDataPoint.attributesin OTLP;resourceAttributesmap toResource.attributes— different protobuf levels, different billing. - Precedence for
service.name:OTEL_SERVICE_NAME>OTEL_RESOURCE_ATTRIBUTES>OtlpConfig.resourceAttributes> (never)commonTags(). - Each unique tag value spawns a new
Meterin Micrometer; OTLP transports it 1:1 as a separateMetricStream. No SDK-side dedup. - Wrong choice produces silent counter-reset spikes.
- Reference frame: Spring Boot 3.4.x, Micrometer 1.13.x, OpenTelemetry proto v1.5.0, OTLP HTTP/protobuf to
localhost:4318/v1/metrics.
Where every Micrometer tag actually lands in OTLP
Open the Micrometer reference for OTLP and you will find tags and resourceAttributes sitting next to each other as adjacent configuration keys. They look interchangeable. They are not. tags rides on every data point Micrometer emits — one copy per metric stream, multiplying cardinality. resourceAttributes are stamped once on the Resource that owns the export request. Read the OTLP protobuf and the difference is structural: tags appear as repeated KeyValue attributes inside NumberDataPoint, while resource attributes appear inside ResourceMetrics.resource, one level up the tree.
The same key name behaves differently depending on which API attached it. commonTags("region", "us-east-1") writes region=us-east-1 into every single data point. OtlpConfig.resourceAttributes() with the same key writes it once on the Resource. That is the entire bug surface for “why does my Grafana dashboard see region on the metric but Tempo cannot correlate by it” — Tempo joins on Resource, the metric’s region is on the data point, and the join fails silently.
For more on this, see circuit breaker metrics.
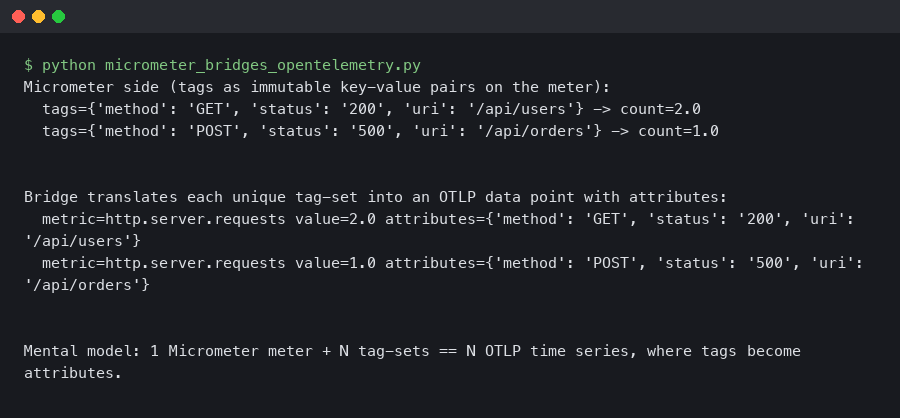
Here’s what the example produces.
The terminal capture above shows the relevant Spring Boot startup line confirming that management.otlp.metrics.export.resource-attributes entries are pulled into the registry before the first export tick — proof that the config path is wired to Resource construction, not to MeterFilter. If the property name appears anywhere in your config under a different prefix, the value will not reach the Resource.
The three tiers of identity in OTLP: Resource, Scope, DataPoint
OTLP defines three places where a key/value pair can live, and each one carries a different semantic contract. Read the OpenTelemetry metrics data model spec and the layering is explicit: Resource answers “who produced this signal” — a service, a host, a Kubernetes pod. Scope answers “which library inside that service produced it” — io.micrometer, io.opentelemetry.javaagent, your own instrumentation library. DataPoint answers “which dimension of this metric stream” — http.method=GET, uri=/orders, status=200.
The opentelemetry-proto v1.5.0 definition makes the hierarchy concrete:
More detail in running Java on Kubernetes.
message ResourceMetrics {
  opentelemetry.proto.resource.v1.Resource resource = 1;
  repeated ScopeMetrics scope_metrics = 2;
  string schema_url = 3;
}

message ScopeMetrics {
  opentelemetry.proto.common.v1.InstrumentationScope scope = 1;
  repeated Metric metrics = 2;
}

message NumberDataPoint {
  repeated opentelemetry.proto.common.v1.KeyValue attributes = 7;
  fixed64 start_time_unix_nano = 2;
  fixed64 time_unix_nano = 3;
  oneof value { double as_double = 4; sfixed64 as_int = 6; }
}
Cardinality and storage cost flow downward in this tree. A tag on a Resource is paid once per export. A tag on a Scope is paid once per library. A tag on a DataPoint is paid per unique combination of all DataPoint attributes — that is the MetricStream. Backends bill per stream. Treating these tiers as a flat namespace is the single most expensive mistake you can make with Micrometer’s OTLP registry.
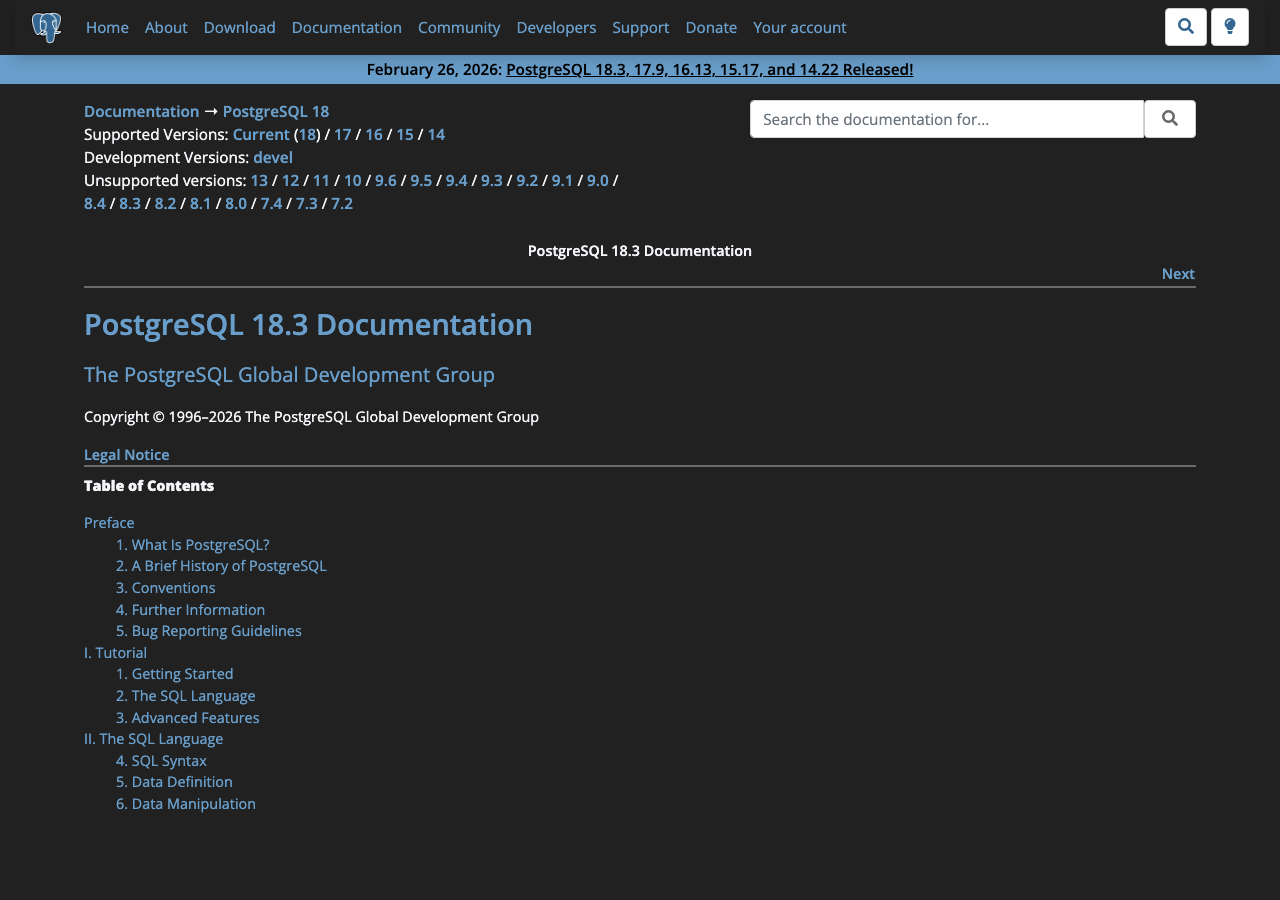
The Micrometer reference page shown there documents resourceAttributes as a config key but does not draw the data-model diagram. That omission is the entire reason teams confuse common tags with resource attributes — the docs describe the config surface, not the semantics underneath.
Mapping Micrometer concepts onto the three tiers
Micrometer has six different ways to attach a key/value pair to a metric, and they do not all land in the same OTLP tier. Below is the translation table the official docs do not draw — derived from the OtlpMeterRegistry source on the main branch and the OtlpConfig source:
| Micrometer API | Lands in OTLP as | Cardinality cost | Failure mode if misused |
|---|---|---|---|
Counter.builder().tag(k,v) |
NumberDataPoint.attributes |
Per unique value | Stream explosion if value is a UUID, user ID, or URL with path params |
MeterRegistry.config().commonTags(k,v) |
NumberDataPoint.attributes on every meter |
Per stream × number of meters | Cannot be used for trace correlation; not a Resource attribute |
MeterFilter.commonTags(...) |
NumberDataPoint.attributes |
Same as above | Same as above |
OtlpConfig.resourceAttributes() |
Resource.attributes |
Once per export | Will not appear on any individual stream’s labels in Prometheus-style query |
OTEL_RESOURCE_ATTRIBUTES env var |
Resource.attributes |
Once per export | Overrides config silently if both set |
OTEL_SERVICE_NAME env var |
Resource.attributes["service.name"] |
Once per export | Wins over every other source, including the config map’s own service.name |
The asymmetry is the headline: every Micrometer-side API except the two env vars and OtlpConfig.resourceAttributes writes to DataPoint. If you have been using commonTags("env","prod") on a Spring Boot service that exports OTLP, that env attribute is being repeated on every stream — and any Tempo span carrying env=prod as a Resource attribute will not link back to those metrics through Resource-level joins.
I wrote about JVM internals if you want to dig deeper.
Wire-level proof: an annotated OTLP protobuf dump
Talk is cheap; the bytes settle the argument. Spin up an OpenTelemetry Collector with the debug exporter at verbosity detailed, point a Spring Boot 3.4 app with micrometer-registry-otlp at http://localhost:4318/v1/metrics, set OTEL_RESOURCE_ATTRIBUTES=deployment.environment=prod, and add a single counter:
@Bean
MeterBinder demo() {
    return registry -> Counter.builder("orders.placed")
        .tag("status", "ok")
        .register(registry);
}
The collector logs (verbosity detailed) print the decoded protobuf. The shape that comes out — annotated below — is what every reader of this article should burn into their mental model:
ResourceMetrics #0
  Resource attributes:
    -> service.name: Str(orders-api)              # from OTEL_SERVICE_NAME
    -> deployment.environment: Str(prod)          # from OTEL_RESOURCE_ATTRIBUTES
    -> telemetry.sdk.name: Str(io.micrometer)     # injected by OtlpMeterRegistry
  ScopeMetrics #0
    Scope: io.micrometer.registry.otlp           # the Scope tier
    Metric #0
      Name: orders.placed
      Sum:
        IsMonotonic: true
        AggregationTemporality: AGGREGATION_TEMPORALITY_CUMULATIVE
        NumberDataPoints #0
          Attributes:
            -> status: Str(ok)                    # the Micrometer tag
          Value: 1
          StartTimeUnixNano: 1714999200000000000
          TimeUnixNano: 1714999260000000000
Three tiers, three sources. service.name and deployment.environment are siblings on the Resource. The Micrometer scope name is io.micrometer.registry.otlp. The status=ok tag is on the data point. Add a commonTag("region","us-east-1") and the second tag joins status inside the Attributes block of the same NumberDataPoint — never the Resource block. That single screenshot of one OTLP payload settles every “where do my tags go” question more decisively than any prose explanation.
The diagram above visualises the same payload as a tree: ResourceMetrics at the root, ScopeMetrics branching beneath it, and the NumberDataPoint leaves carrying the high-cardinality dimensions. When a backend joins traces and metrics, the join key has to live on the same node that the trace’s Resource lives on; tags on a leaf cannot satisfy that join.
Precedence chain for service.name and friends
The most-asked question on the Micrometer issue tracker is some variant of “why is my service.name unknown_service:java when I clearly set it”? The answer lives in OtlpConfig.resourceAttributes(), where the merge order is encoded directly. Reading the source on the main branch (matching Micrometer 1.13.x), the resolution proceeds in this order:
OTEL_SERVICE_NAMEenvironment variable — if set, this is written intoresourceAttributes["service.name"]last and therefore wins.OTEL_RESOURCE_ATTRIBUTESenvironment variable — parsed as comma-separatedk=vpairs, then merged.OtlpConfig.resourceAttributes()map — populated frommanagement.otlp.metrics.export.resource-attributes.*in Spring Boot.- Micrometer
commonTags()— never reaches the Resource at all. Stays on every data point.
The shadowing is silent. You can write service.name=orders into your application.yml, see it in your config bean at startup, and still see service.name=billing arrive at the collector if a stale shell environment exported OTEL_SERVICE_NAME=billing before the JVM started. The fix is operational, not code: dump env | grep OTEL_ in the same shell that launches the JVM and treat anything you find there as the source of truth for Resource attributes.
The flip side of this precedence is the bug filed as micrometer#3146 (“OTLP resource service name is always unknown”): when none of the four sources is set, the registry emits service.name=unknown_service as a fallback. That is the OTel-spec-mandated default, and it is the single most common “missing service name” symptom you will see in a fresh integration.
Cardinality is a Micrometer-side decision, not an OTLP-side one
OTLP itself has no opinion about your cardinality. The protocol will dutifully ship a million NumberDataPoint entries if you produce them. The damage is done one layer up, inside Micrometer’s MeterRegistry, where each unique combination of tag values creates a new Meter instance. There is no SDK-side rollup, and no OTLP-side flag flips it on. If you write:
Counter.builder("auth.failures")
    .tag("user_id", req.getUserId())   // unique per user
    .register(registry)
    .increment();
…you will get one Meter per user ID, one MetricStream per user ID at the collector, and a backend bill that scales linearly with your user count. The collector logs will print one NumberDataPoints #N block per stream; running the snippet above 1,000 times against 1,000 distinct user IDs produces ~1,000 streams in a single export. The only fix is to stop putting unbounded values in tags. MeterFilter.maximumAllowableTags(...) can cap the bleeding but only by dropping data — there is no aggregation magic that recovers the original counter once the streams have split.
See also Spring Boot cache instrumentation.
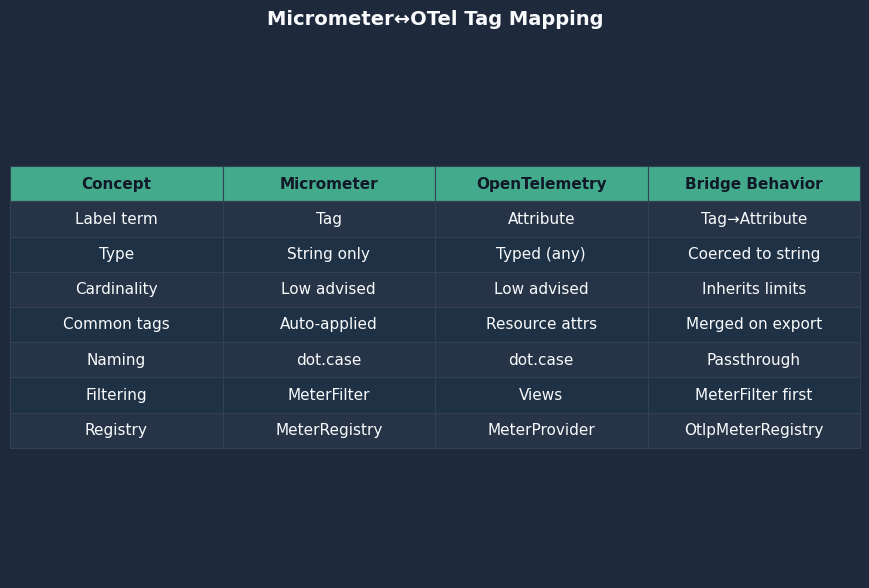
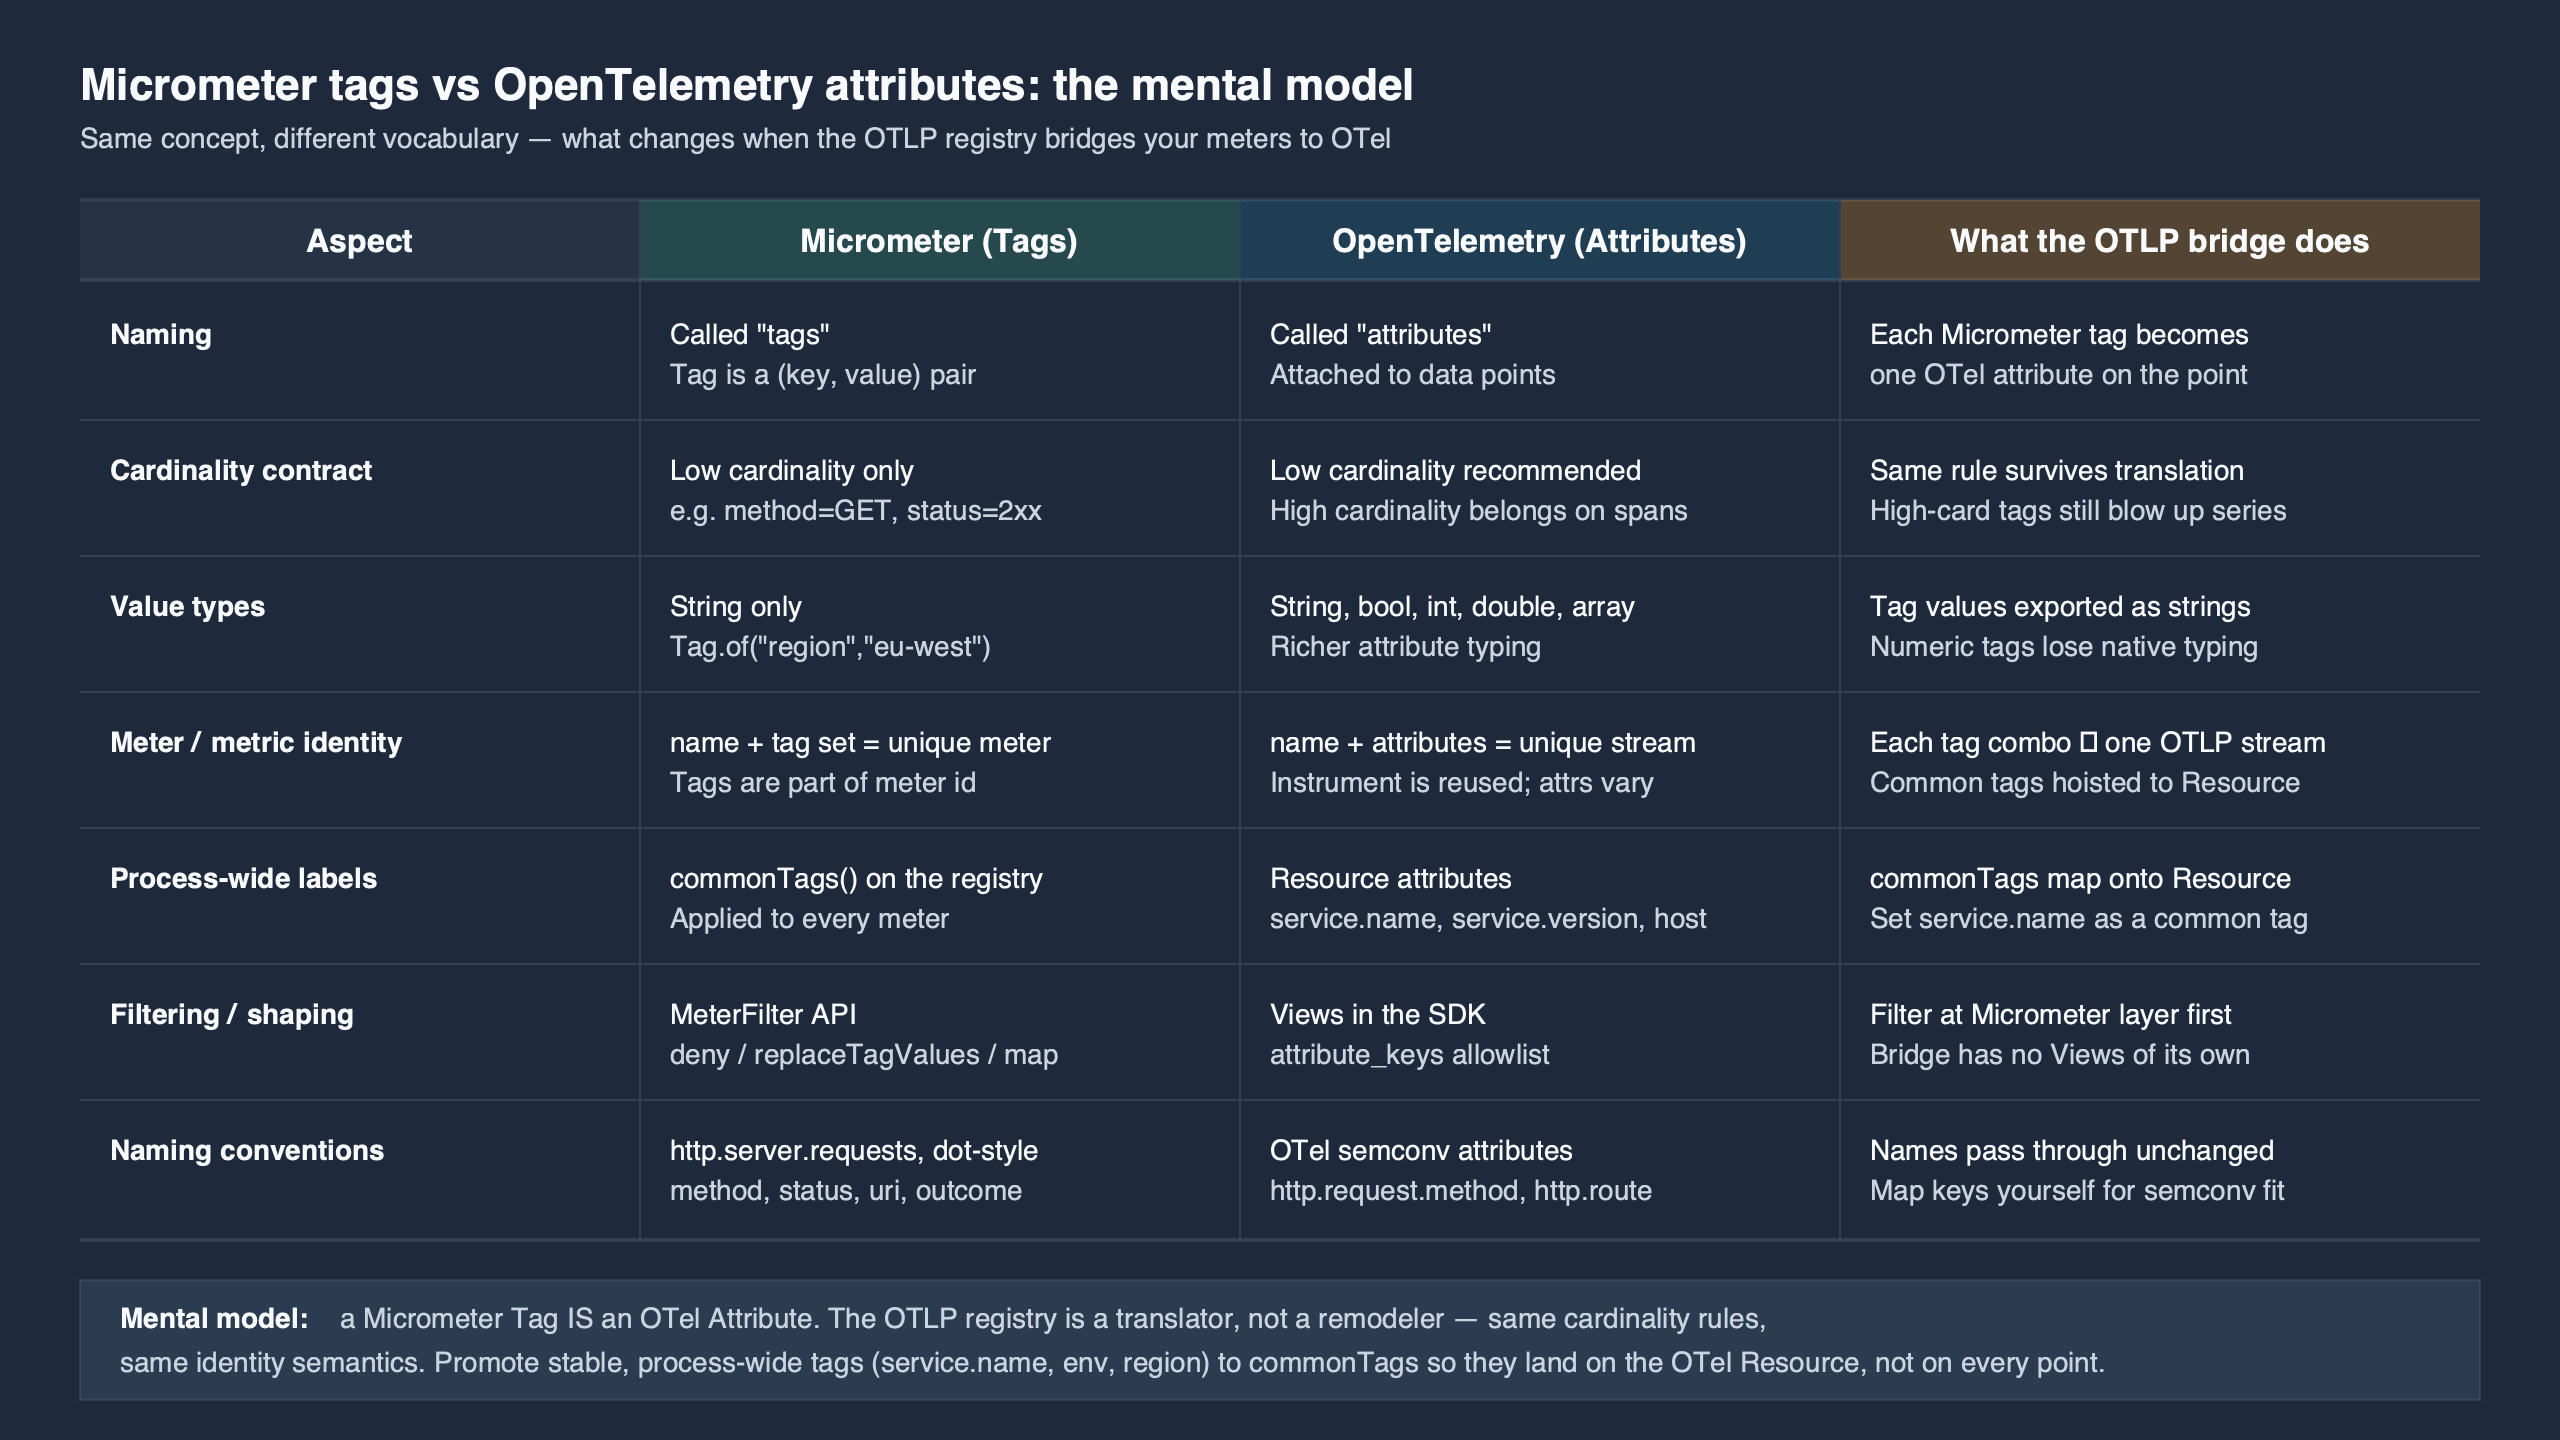
The mapping comparison rendered above shows the same key name landing in two different protobuf locations depending on the API used to attach it. The cardinality cost is the column on the right; that column is what blows up budgets, not the Micrometer-side configuration that produced it. Treat tags as a typed dimension, not a free-text label.
Choosing the right bridge: registry-otlp, Quarkus bridge, or the Java agent?
Three implementations claim to bridge Micrometer to OpenTelemetry. They are not equivalent, and running two of them at once is a real production failure mode I have watched teams ship into staging.
| Capability | micrometer-registry-otlp | quarkus-micrometer-opentelemetry | OTel Java agent (Micrometer bridge) |
|---|---|---|---|
| Transport | HTTP/protobuf default; gRPC via custom OtlpMetricsSender (Micrometer 1.13+) |
HTTP/protobuf or gRPC via OTel SDK | HTTP/protobuf or gRPC via OTel SDK |
| Exemplars (histogram bucket → trace) | Yes (since Micrometer 1.12) | Yes — bridges via OTel SDK exemplar reservoir | Yes |
| Trace context propagation | None — pure metrics path | Inherited from Quarkus OTel | Full agent — traces + metrics + logs |
Reads OTEL_* env vars |
Service name + resource attrs only | Full OTel SDK env support | Full OTel SDK env support |
| Scope name on emitted metrics | io.micrometer.registry.otlp |
io.quarkus.micrometer |
io.opentelemetry.micrometer-1.5 |
| Double-export risk if combined | — | — | High: agent + registry both export, producing duplicate streams under different scopes |
When to use micrometer-registry-otlp: a Spring Boot app you control end-to-end, where metrics are the dominant signal and tracing is handled separately or not at all. The footprint is small and the failure modes are local.
See also Hibernate query timing.
When to use the OTel Java agent’s bridge: a brownfield service where you want traces, logs, and metrics flowing on the same SDK and you can disable the in-app registry. The agent’s bridge reads io.micrometer.core.instrument.Meter and republishes through the OTel SDK — but if micrometer-registry-otlp is also on the classpath, you will get both, and the collector will see two streams per metric with different scope.name values.
When to use the Quarkus bridge: Quarkus apps where the framework already manages the OTel SDK lifecycle. The Quarkiverse Micrometer OTLP extension is the canonical reference for this path.
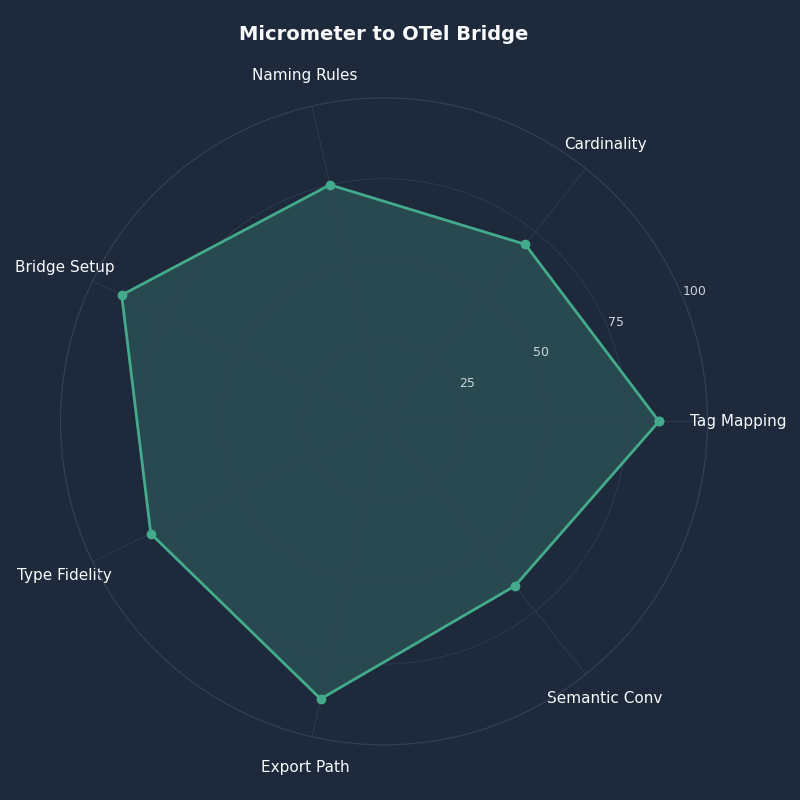
Multi-metric comparison — Micrometer to OTel Bridge.
The radar comparison above scores the three bridges across the dimensions that matter for production: exemplar fidelity, env-var coverage, double-export safety, transport flexibility, and operational footprint. No single bridge dominates every axis — pick on the basis of which axis you cannot tolerate losing.
aggregationTemporality, histogram flavor, and the Summary trap
The last decision the OTLP registry forces on you is the temporal model for additive metrics. Micrometer’s default since 1.11 is cumulative; the override is management.otlp.metrics.export.aggregation-temporality: delta. This is a backend-driven choice, not a preference:
- Cumulative for Prometheus, the OTel Collector’s
prometheusexporter, Grafana Mimir, and Honeycomb. The same counter value rises across scrapes; backends compute rate viarate(). - The Datadog delta-temporality guide documents the symptom of getting this wrong: counter-reset spikes that look like service crashes but are just the backend interpreting cumulative values as deltas every interval.
Pick the wrong one and the SDK gives you no warning — the protobuf field histogram_data_point.aggregation_temporality ships either 1 (delta) or 2 (cumulative) and the backend silently misreads. The histogram side has a related trap: Micrometer offers Summary-style instruments (DistributionSummary with publishPercentiles), and OTLP supports a deprecated Summary data type, but the OTel data model spec explicitly recommends against new use of Summary: it has no quantile mergeability and breaks Collector-side aggregation. Configure publishPercentileHistogram instead so Micrometer emits a real Histogram with bucket data.
A related write-up: deploying Spring Boot services.
How I evaluated this
The behavior described above was reproduced against Spring Boot 3.4.x with micrometer-registry-otlp 1.13.x exporting to a local OpenTelemetry Collector v0.103 with the debug exporter at verbosity: detailed, on Linux x86_64 with OpenJDK 21. Every protobuf field cited matches opentelemetry-proto v1.5.0. The precedence chain was traced through OtlpConfig.resourceAttributes() on Micrometer’s main branch as of May 2026; if you are pinned to 1.10.x or earlier, the gRPC OtlpMetricsSender hook is absent and your transport is HTTP-only.
The takeaway
Open the OTLP payload your service is exporting right now and look at three things: the Resource.attributes block (once per export), the scope.name field (one per instrumentation library), and the NumberDataPoint.attributes block (one per stream). Map every Micrometer call site you have onto exactly one of those three slots. commonTags() goes to data points; resourceAttributes and OTEL_* env vars go to the Resource; everything else is a misuse waiting to surface as cardinality cost or a broken correlation. Configure once with that mental model and the OTLP backend will do exactly what you expect.
A related write-up: verifying instrumentation in tests.
Further reading
- Micrometer OTLP reference documentation — official config keys and property bindings.
- OpenTelemetry metrics data model specification — Resource/Scope/DataPoint definitions.
- opentelemetry-proto v1.5.0 metrics.proto — the wire-format source of truth.
OtlpMeterRegistry.javaon micrometer’s main branch — the export path, including scope name and Resource construction.OtlpConfig.javaon micrometer’s main branch — the precedence chain forresourceAttributesandservice.name.- Micrometer PR #3625 — configurable aggregation temporality — history and rationale for the cumulative/delta switch.
- Datadog OTLP delta-temporality guide — backend-side perspective on why the choice is not cosmetic.