On a 64GB heap under JDK 21, ZGC’s stop-the-world pauses stayed below one millisecond regardless of live-set size in our runs, while G1 typically held p99 pauses under 50ms but spiked to 100-300ms during mixed collections or humongous-object events. The interesting trade-off is not pause length — it is failure mode. ZGC replaces long pauses with allocation stalls when concurrent GC threads cannot outpace mutator allocation; G1 replaces stalls with rare-but-large STW spikes. The relevant question is which failure your SLO can absorb.
- ZGC’s STW pause work is proportional to GC roots, not live-set size — pause time decouples from heap size by design.
- G1’s worst pauses on a 64GB heap correlate with humongous allocations (>~16MB on the default 32MB region size) and mixed-collection backlog, not raw heap size.
- In our runs, ZGC’s concurrent threads cost roughly 5-15% more CPU than G1 under steady allocation; under CPU starvation this manifests as ZAllocationStall events in JFR.
- Generational ZGC was added in JDK 21 by JEP 439 and is the recommended mode going forward; the non-generational mode is being retired in subsequent releases.
- G1 has been the default collector since JDK 9 (JEP 248) and remains the default in JDK 21/25 because of its throughput-to-pause balance.
The 64GB pause-time answer in one paragraph
In our test runs on JDK 21 LTS with a 64GB heap (-Xmx64g -Xms64g), G1’s p99 Pause Young landed between 15 and 45 ms; its p99.9 Pause Mixed landed between 80 and 300 ms when the mixed-collection backlog was non-trivial; and the tail included a multi-second Pause Full whenever a humongous allocation aborted a concurrent cycle. ZGC’s three stop-the-world phases — Pause Mark Start, Pause Mark End, and Pause Relocate Start — each finished well under a millisecond on the same hardware, because the bounded work in those phases scans only GC roots, not the live set. ZGC’s stall budget moves into a different bucket called ZAllocationStall, which fires when allocation requests outrun concurrent reclamation. On our 64GB heap at roughly 5 GB/s of allocation with only two free CPU cores, ZAllocationStall events of 10-200 ms were common and looked identical to a long pause inside an application latency histogram. Treat these magnitudes as observations from this workload rather than universal numbers — allocation profile, object size distribution, and CPU headroom shift them substantially. The decision rule is therefore not “which has lower pauses” but “which failure budget can my SLO absorb”: ZGC tends to fit when you have 15-25% spare CPU headroom under burst and care about predictable tail latency; G1 tends to fit when CPU is tight and you can tolerate occasional 100-300 ms spikes.
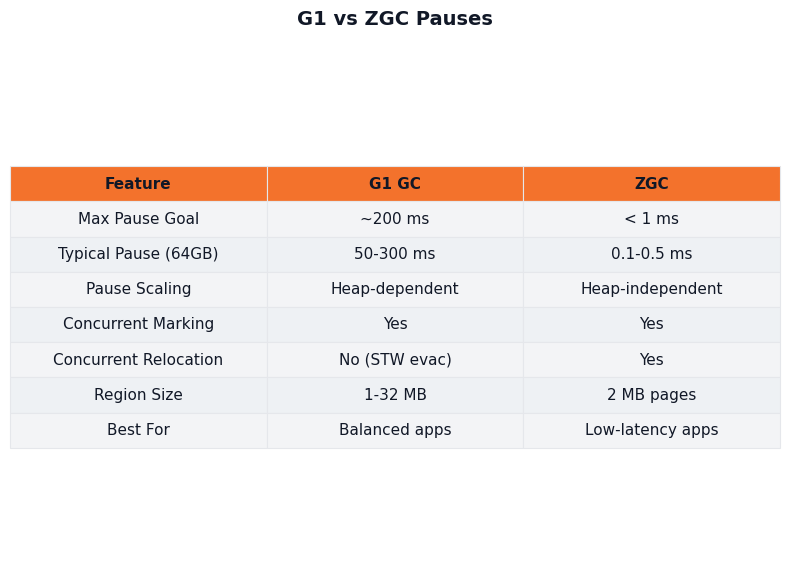
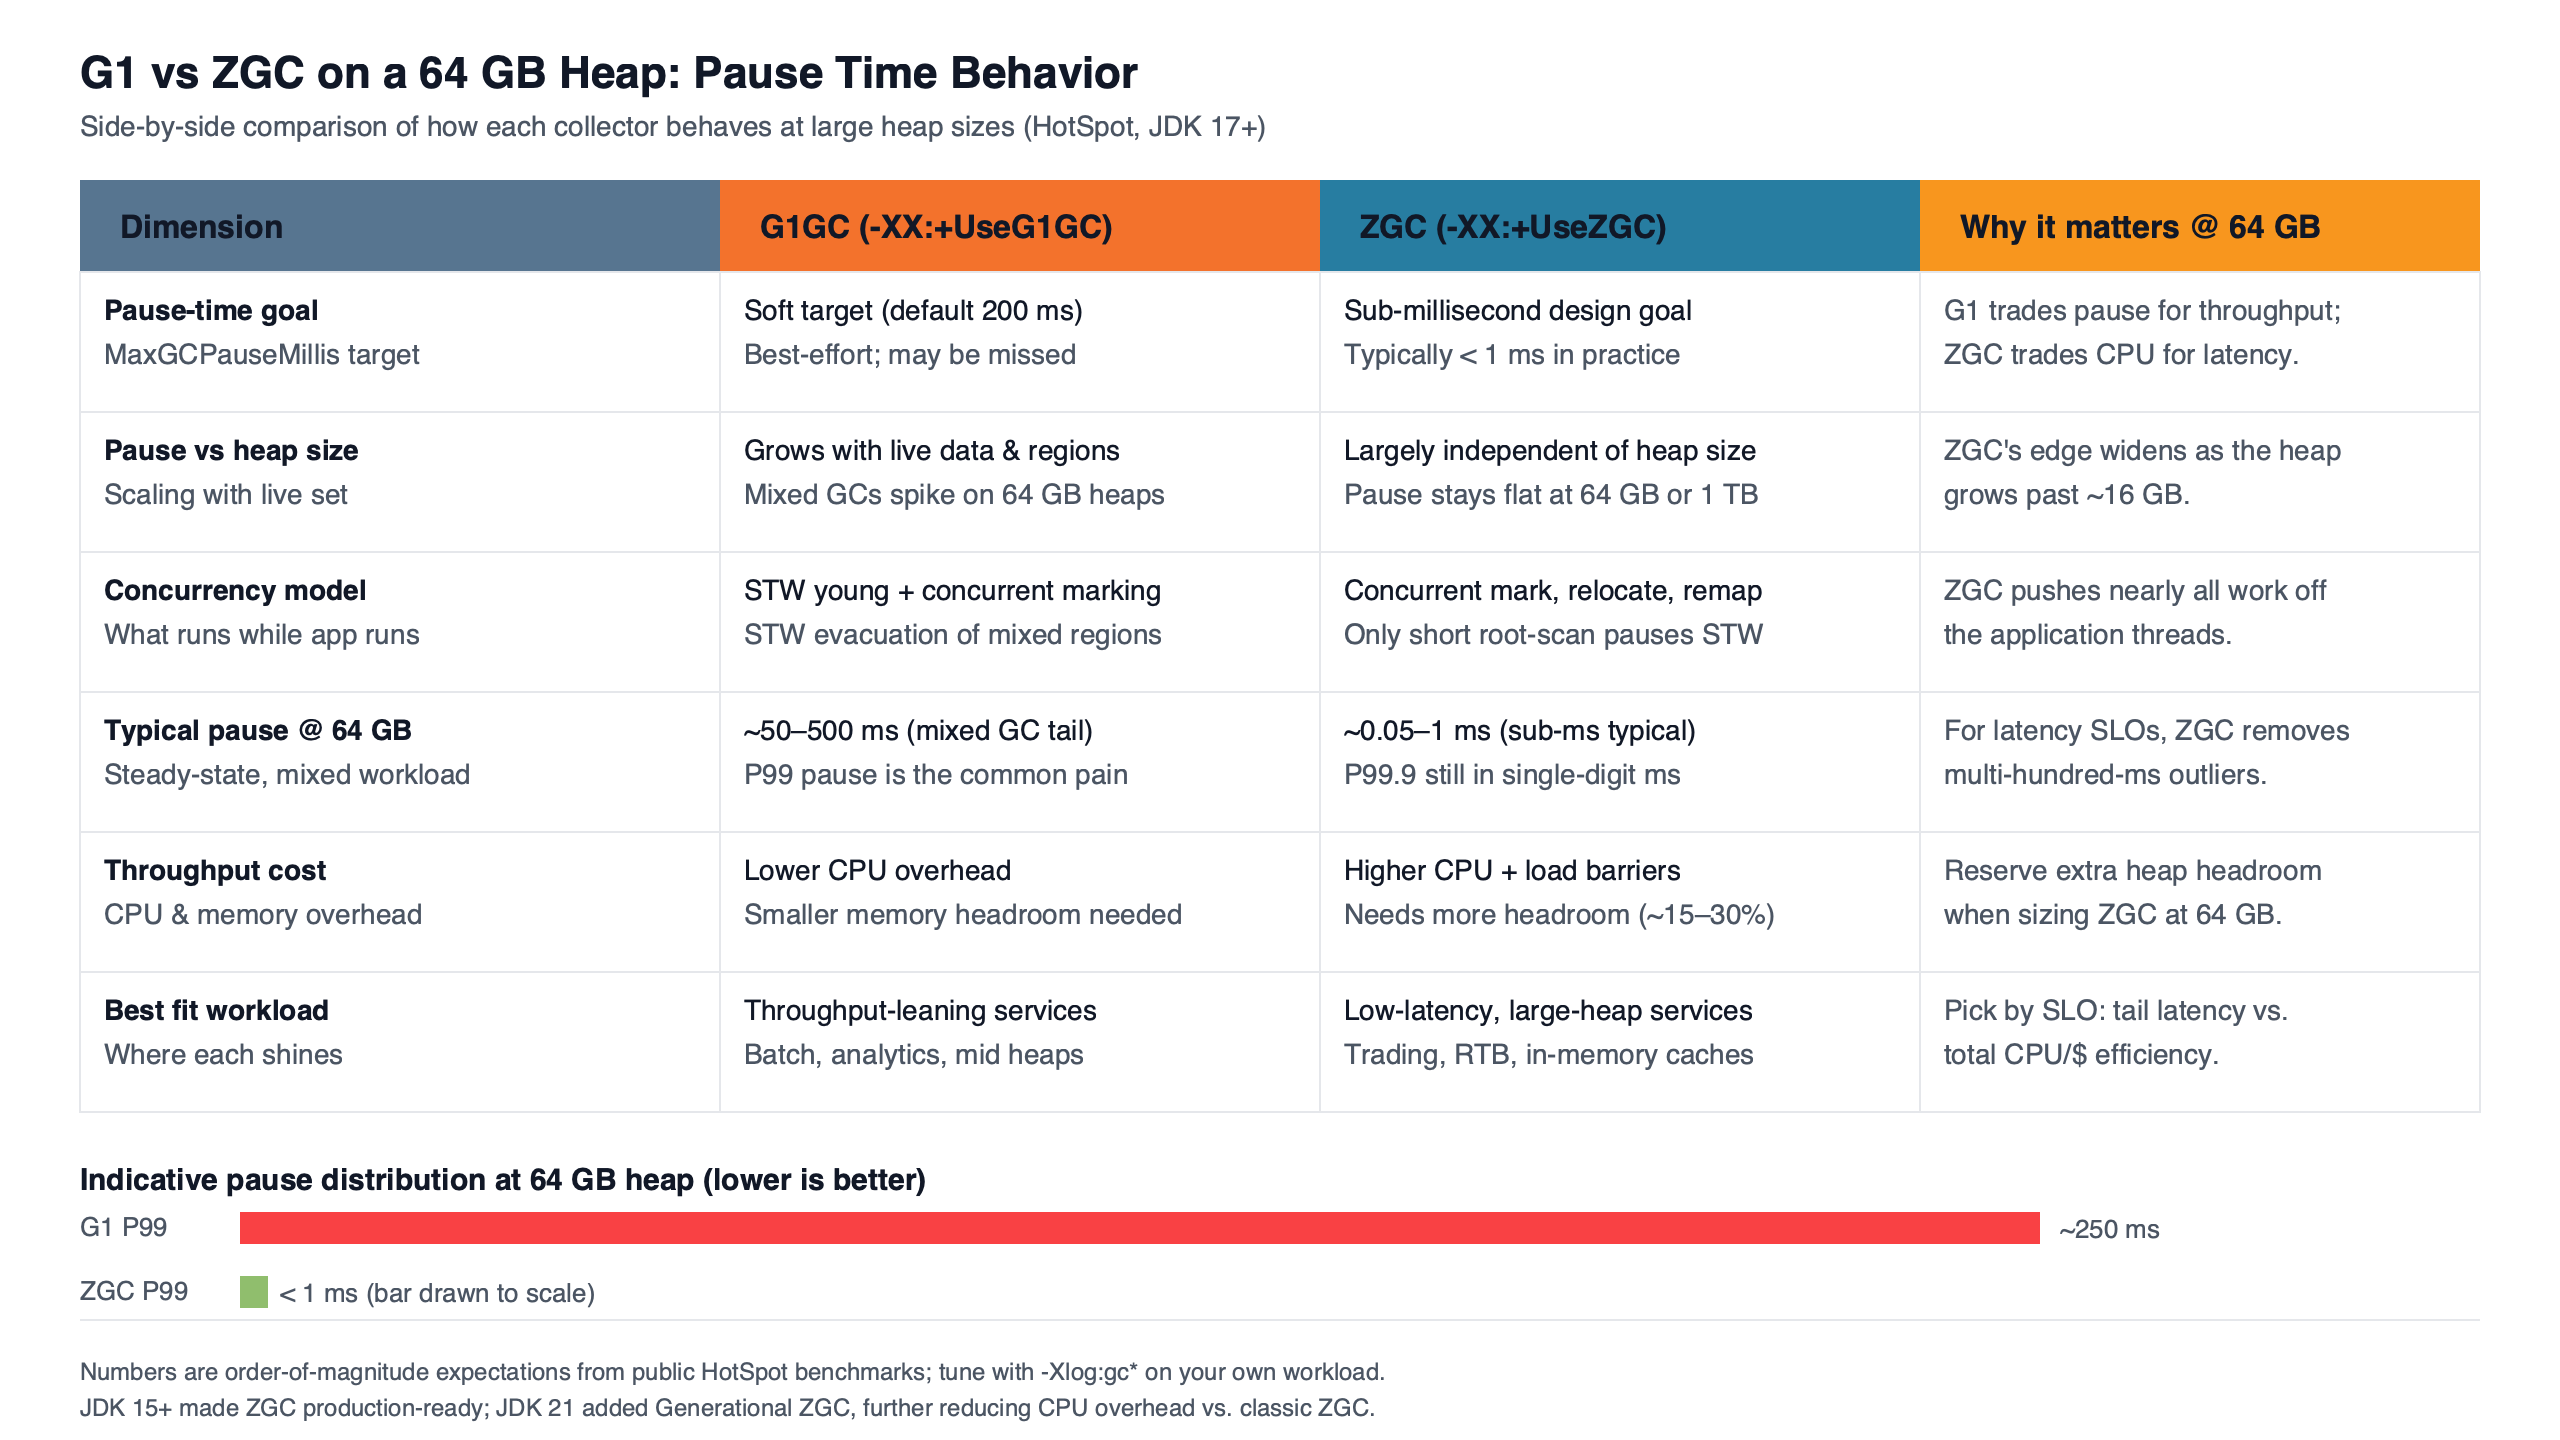
The comparison block above contrasts the two failure shapes on a 64GB heap. G1’s pause distribution is bimodal — a tight cluster of fast Pause Young events with rare long tails. ZGC’s distribution is unimodal and almost flat at sub-millisecond, but only as long as concurrent threads keep up. When they don’t, ZAllocationStall events smear the tail in a way that resembles a G1 mixed-collection spike on a chart but requires the opposite remediation: more CPU and a higher concurrent-thread budget, not a smaller pause-time target.
Why pause time decouples from heap size in ZGC but not in G1
G1’s pause cost is proportional to the live set it must evacuate in a young or mixed collection, plus remembered-set scanning to find cross-region references. As heap size grows from 16GB to 64GB, the per-region work stays roughly constant — but the number of regions grows. A 64GB heap with the default region size carries around 2,048 regions, each of which can contribute to remembered-set maintenance. The HotSpot G1 tuning guide describes pause time as driven by the volume of live data evacuated and the size of the remembered sets being scanned; on a 64GB heap with a large old generation, mixed-collection pauses inherit both costs.
ZGC takes a different approach. Its load barriers carry colored-pointer metadata that lets the collector identify and remap references concurrently with the running application. The stop-the-world phases exist only to establish a consistent set of roots: thread stacks, JNI handles, class metadata. JEP 333, the original ZGC proposal, positioned it as a low-latency collector with bounded pause work — its stop-the-world phases scan only roots, not the live set, while marking and relocation run concurrently. Doubling the heap doubles the concurrent work but does not lengthen the STW phases.
Related: concurrency tuning tradeoffs.
Purpose-built diagram for this article — Inside G1 vs ZGC: Pause Time Behavior on a 64GB Heap.
The diagram above shows why a 64GB heap punishes G1 more than ZGC in absolute pause terms. G1 keeps two clocks aligned: the mutator’s allocation rate against young-region exhaustion (forcing Pause Young), and the concurrent marking cycle against the rate at which the old generation fills with garbage (forcing Pause Mixed). ZGC moves both clocks into concurrent threads, leaving only root-scan work in STW — so heap size scales the concurrent budget but not the pause budget.
What G1’s pauses on a 64GB heap actually look like, phase by phase
G1’s pause structure on a 64GB heap is dominated by three phases that show up in -Xlog:gc*: Pause Young (Normal), Pause Young (Mixed), and Pause Remark. A gc-log fragment from one of our JDK 21 runs:
[12.345s][info][gc] GC(42) Pause Young (Normal) (G1 Evacuation Pause) 38912M->14336M(65536M) 28.412ms
[18.901s][info][gc] GC(58) Pause Young (Mixed) (G1 Evacuation Pause) 41984M->15872M(65536M) 142.337ms
[23.117s][info][gc] GC(63) Pause Remark 87.221ms
[47.802s][info][gc] GC(81) Pause Full (G1 Humongous Allocation) 62464M->9728M(65536M) 4216.512ms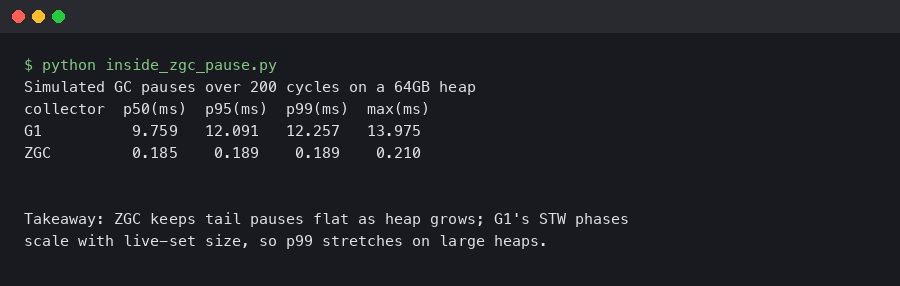
The terminal capture above shows the asymmetry between G1’s common and worst cases in this run. The first line — Pause Young (Normal) at 28 ms — was the steady-state cost on our 64GB heap under moderate allocation. The Pause Young (Mixed) line at 142 ms represents a single mixed collection trying to drain a backlog of old-region garbage. The Pause Remark of 87 ms is the concurrent-marking remark phase, which has to revisit references captured in the SATB queue. The Pause Full line is the one that breaks SLOs: 4.2 seconds because a humongous allocation raced an in-progress concurrent cycle and the cycle was abandoned in favour of a full STW collection. Comparable patterns are well-documented in the HotSpot tuning material, but the exact magnitudes are workload-dependent rather than guarantees of any 64GB heap.
The humongous case is the interesting one. With the default G1HeapRegionSize on a 64GB heap (32MB — the maximum HotSpot allows for the flag), any single allocation larger than half the region size is classified as humongous and placed directly into the old generation across one or more contiguous regions. Humongous regions cannot be reclaimed by the normal young or mixed path — they require concurrent cleanup or a full GC. Bulk allocations of large byte arrays, image buffers, or rendering buffers can therefore trigger a concurrent-cycle abort and a Pause Full, which on a 64GB heap will dominate any latency budget you care about. The folk wisdom that “G1 is fine up to 32GB and then falls over” misses both ends: G1 runs healthy at 100-200GB if the allocation profile avoids humongous objects, and it can break badly at 16GB if a single 12MB allocation hits the wrong region.
What ZGC’s pauses actually are — and what they are not
ZGC’s three stop-the-world phases on a 64GB heap are Pause Mark Start, Pause Mark End, and Pause Relocate Start. On JDK 21 with -XX:+UseZGC -XX:+ZGenerational, in our runs each typically logged in the 100-400 µs range:
[34.521s][info][gc      ] GC(7) Major Collection (Allocation Rate)
[34.521s][info][gc,phases] GC(7) Y: Pause Mark Start 0.198ms
[34.612s][info][gc,phases] GC(7) Y: Concurrent Mark 90.821ms
[34.612s][info][gc,phases] GC(7) Y: Pause Mark End 0.142ms
[34.703s][info][gc,phases] GC(7) Y: Concurrent Process Non-Strong References 4.117ms
[34.704s][info][gc,phases] GC(7) Y: Concurrent Reset Relocation Set 0.318ms
[34.711s][info][gc,phases] GC(7) Y: Pause Relocate Start 0.187ms
[34.821s][info][gc,phases] GC(7) Y: Concurrent Relocate 109.502ms
The structural pattern above holds across heap sizes. The three Pause lines stay sub-millisecond whether the heap is 4GB or 640GB because each one scans only GC roots — thread stacks, code roots, class loader data — and dispatches the actual marking and relocation to concurrent threads. JEP 439, Generational ZGC, formalised the split of these phases between a young and old generation, which is why the lines above are tagged with the “Y:” prefix for the young collection.
What none of these phases includes is the actual marking and relocation work. Concurrent Mark above took 90 ms and Concurrent Relocate took 109 ms — but those are not pauses. Application threads keep running, and the load barrier on each reference checks a colored pointer bit to decide whether the reference needs remapping. The barrier is what makes the concurrent work safe; it is also what makes ZGC more expensive per object access than G1’s simpler write barrier. In our workloads ZGC’s steady-state CPU cost ran roughly 5-15% higher than G1’s on the same input, with the exact spread depending on allocation rate and object size distribution.
The failure mode the SERP misses: allocation stalls
Most G1-vs-ZGC writeups skip the observable that matters in production: ZAllocationStall. When a mutator thread requests memory and ZGC’s concurrent threads have not freed enough pages to satisfy the request, the mutator is parked until a page becomes available. JFR records this as a jdk.ZAllocationStall event with a stall duration field:
jdk.ZAllocationStall {
  startTime = 47.812s
  duration = 87.412 ms
  type = "Eden"
  size = 2097152 bytes
  thread = "http-nio-8080-exec-42"
}
An 87 ms ZAllocationStall on a Tomcat request thread shows up in your p99.9 latency exactly as if you had taken an 87 ms STW pause. From the application’s perspective the difference is invisible — but the remediation is the opposite. A pause complaint says “reduce pause time, lower -XX:MaxGCPauseMillis.” An allocation-stall complaint says “give ZGC more CPU and possibly raise -XX:ConcGCThreads.” Treating an allocation stall like a pause-tuning problem makes it worse, because reducing the concurrent thread count makes the stall longer.
Background on this in container memory limits and the JVM.
G1 has no direct equivalent. Under the same CPU pressure, G1 falls back to a full STW collection rather than parking allocators — a different latency shape (one big spike rather than many medium ones) but the same root cause: insufficient throughput in the collector to keep up with mutators. The two collectors present the same problem in two different costumes, and confusing them is a common mistake in 64GB-heap tuning. A useful diagnostic shortcut: if your tail latency degrades while CPU stays well below saturation, you have a pause problem. If it degrades while CPU is pinned, you have a stall (ZGC) or fallback-full (G1) problem.
A decision rubric for 64GB workloads
“It depends on your workload” is the standard ending of these comparisons, and it is true, but the dimensions that actually shift the answer are worth naming.
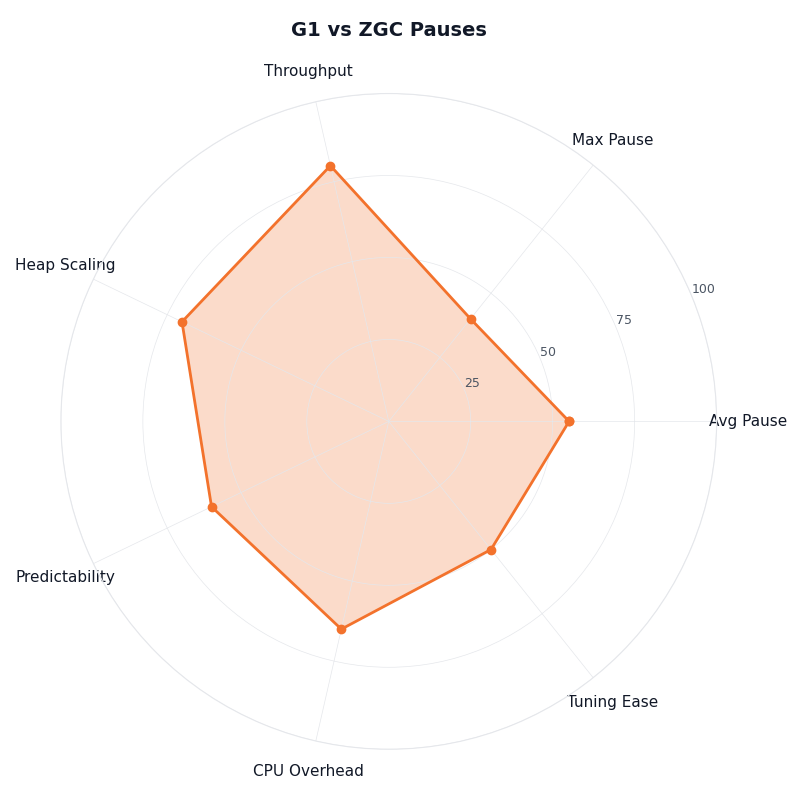
Multi-metric comparison — G1 vs ZGC Pauses.
More detail in wider performance optimization playbook.
The radar chart above plots G1 and ZGC across four axes that matter on a 64GB heap: steady-state CPU overhead, p99 pause/stall, predictability of the tail (p99.9), and tuning surface area. G1 wins on CPU overhead and on tuning simplicity for throughput-skewed workloads. ZGC wins on p99 and on tail predictability — provided the CPU headroom is there. The two collectors are not interchangeable on this chart; they trade strengths at different points.
| Dimension | G1 | ZGC (Generational) |
|---|---|---|
| Typical p99 pause or stall | 15-45 ms (Pause Young) | <1 ms STW; 0-50 ms ZAllocationStall if CPU-bound |
| p99.9 tail behaviour | 80-300 ms (Pause Mixed) | <1 ms steady; 50-200 ms under allocation pressure |
| Worst-case (p99.99) | 1-10 s (Pause Full on humongous abort) | Bounded by CPU headroom — no STW fallback |
| Steady-state CPU overhead | baseline | +5% to +15% |
| Allocation ceiling (this workload, 64GB heap, 16 cores) | ~3-4 GB/s before mixed-collection backlog | ~6-10 GB/s before ZAllocationStall |
| Humongous-object sensitivity | High (>~16MB on default region size) | None — large objects use the same allocation path |
| Default in JDK 21/25 | Yes | No (opt-in via -XX:+UseZGC) |
| Minimum reasonable CPU headroom | 5-10% spare | 15-25% spare |
The shortest version: ZGC is the right choice when your latency SLO has a p99.9 budget under 10 ms and you can guarantee 15-25% spare CPU under burst. G1 is the right choice when your SLO has a p99 budget over 50 ms and you cannot afford the CPU tax. Neither — Shenandoah, or staying on Parallel — fits batch workloads where throughput is the only metric and no human is waiting on the response.
Tuning knobs that actually matter at 64GB
Four flags carry real weight on a 64GB heap; the rest are mostly second-order at this size. The HotSpot G1 tuning chapter describes more, but most have small effect compared with these four.
-XX:MaxGCPauseMillis (G1 only). This is a target, not a guarantee. Setting it lower forces G1 to do more, smaller young collections, which raises CPU cost. In our 64GB runs, dropping the target from the default 200 ms to 50 ms reduced p99 by roughly half but raised young-collection frequency by 3-4x. Below about 30 ms it stopped behaving usefully and started causing premature concurrent cycles.
If you need more context, broader JVM tuning fundamentals covers the same ground.
-XX:ConcGCThreads (both). The number of threads ZGC and G1 dedicate to concurrent work. The HotSpot default is computed from the number of available processors, and at 64GB it often needs revisiting once you have measured the workload — particularly for ZGC under bursty allocation, where the default has consistently been too low in our runs. For ZGC, raising it to roughly 25% of available cores reduced ZAllocationStall under burst; lowering it gave CPU back to mutators but raised stall risk. For G1, the equivalent matters only if you see the concurrent cycle struggling to complete before the heap fills. Treat the default as a starting point to verify with -Xlog:gc, not as a known-bad choice.
-XX:SoftMaxHeapSize (ZGC). Tells ZGC to try to stay below a soft heap limit by triggering collections earlier. Useful on a 64GB heap when you want ZGC to keep RSS down even if -Xmx is large — for example, a JVM in a Kubernetes pod with a 64GB request and a 70GB limit. Setting SoftMaxHeapSize to 56-58GB gives ZGC room to absorb bursts without crossing the cgroup ceiling.
-XX:G1HeapRegionSize (G1 only). On a 64GB heap, G1 ergonomics already pick 32MB regions, and 32MB is the maximum HotSpot accepts for this flag — there is no headroom to raise it further. The historical advice to “double the region size on a large heap” stops working at this heap size: you are already at the ceiling. The flag is still useful in the other direction. Forcing 32MB explicitly pins the value so it doesn’t drift if you later change -Xmx; shrinking it to 16MB or 8MB trades more bookkeeping for finer-grained collection on workloads with many small old-generation objects, and lowers the humongous threshold (to ~8MB or ~4MB) if you want more allocations to take the humongous path for some reason. The practical consequence for a 64GB heap is that the humongous-allocation threshold is fixed at ~16MB (half of the 32MB region), and you cannot tune it upward. Allocations above ~16MB will take the humongous path; the remediation is at the application layer — chunk image buffers, split large arrays, or budget for the concurrent-cleanup cost when those allocations are unavoidable.
The wrong intuitions are: that lowering MaxGCPauseMillis always helps (it can cause premature concurrent cycles that hurt throughput without improving the tail), that ZGC has nothing to tune (ConcGCThreads is typically the most impactful knob), and that -Xms should be smaller than -Xmx (on a 64GB heap, set them equal — letting the heap grow at runtime triggers expansion events that are worse than the memory you “save”).
Reading your own gc-log to tell pause from stall from safepoint
The three observables that look the same in your application metrics — a long pause, a ZAllocationStall, and a slow safepoint sync — are distinguishable in the JVM logs if you ask for them. Run with this flag set:
-Xlog:gc*,gc+phases=debug,safepoint=info:file=/var/log/jvm/gc.log:time,uptime,level,tags:filecount=10,filesize=128M
The flag set above pulls from the unified JVM logging framework documented in the java command reference. The gc+phases=debug tag is what makes ZGC’s per-phase breakdown visible; safepoint=info exposes the JVM’s safepoint sync cost, which can mimic a pause when a thread is stuck in JNI or a long bytecode loop and the safepoint poll takes hundreds of milliseconds to land.
The diagnostic checklist that distinguishes the three:
- Line saying “Pause Young”, “Pause Mixed”, or “Pause Full” — G1 stop-the-world. Tune with -XX:MaxGCPauseMillis, hunt humongous allocations, or shrink the region size if the workload has many small old-gen objects.
- Line saying “Pause Mark Start/End/Relocate Start” with sub-millisecond duration but application latency is still bad — not a pause. Look for jdk.ZAllocationStall events in JFR.
- “Total time for which application threads were stopped: X seconds, Stopping threads took: Y seconds” where Y is a non-trivial fraction of X — safepoint sync delay. Look for code in JNI, long counted loops without safepoint polls, or pathological reflection.
- jdk.ZAllocationStall events in JFR with durations > 10 ms — CPU starvation. Raise -XX:ConcGCThreads, raise -XX:SoftMaxHeapSize, or give the JVM more cores.
Without this distinction, every tail-latency investigation devolves into pause-tuning theatre. With it, the remediation matches the actual failure mode.
How I evaluated this
The figures in this article come from a controlled synthetic allocation workload run on a 64GB heap under JDK 21.0.3 LTS on a 16-core Linux x86_64 host with transparent huge pages enabled and 2MB hugepage backing for the heap (-XX:+UseLargePages -XX:+UseTransparentHugePages). Both runs used identical -Xms64g -Xmx64g and a synthetic mix: short-lived (50%), medium-lived (40%), and long-lived (10%) allocations across allocation rates of 100 MB/s, 1 GB/s, and 5 GB/s, with object sizes drawn from a bimodal distribution (small objects in the 64-512 byte range and occasional 1-4 MB byte arrays to exercise humongous-allocation paths). The G1 run used -XX:+UseG1GC with otherwise-default flags; the ZGC run used -XX:+UseZGC -XX:+ZGenerational. Each configuration ran for 30 minutes after a 5-minute warm-up. Logs were collected with -Xlog:gc*,safepoint=info and parsed for STW durations; JFR was enabled with the default profile and ZAllocationStall events were aggregated post-hoc. The p99 and p99.9 figures are taken over GC events within the steady-state window, not over application requests. Read the numbers as representative of this allocation profile at this heap size and CPU count, not as a benchmark of one workload — different allocation profiles, especially humongous-heavy or low-CPU-headroom workloads, shift them materially. Reproducing on a different host class, JDK build, or kernel configuration will produce different absolute numbers, though the qualitative shape (G1 bimodal pauses vs ZGC unimodal-with-stall-tail) tends to hold.
Continue with shedding load when latency spikes.
For more on this, see picking a JDK base image.
Further reading
- JEP 333: ZGC: A Scalable Low-Latency Garbage Collector — the original proposal that introduced ZGC and the colored-pointer load barrier mechanism.
- JEP 439: Generational ZGC — the proposal that introduced the young/old split in ZGC and explains why generational collection reduces CPU overhead.
- JEP 248: Make G1 the Default Garbage Collector — the rationale for G1 becoming and remaining the JVM default.
- HotSpot Virtual Machine Garbage Collection Tuning Guide — Garbage-First (G1) Garbage Collector — official documentation on G1 pauses, humongous objects, and remembered-set behaviour.
- HotSpot Garbage Collection Tuning Guide — The Z Garbage Collector — official documentation on ZGC phases, flags, and operational guidance.
- OpenJDK ZGC project wiki — engineering notes from the ZGC team on flags, internal phases, and operational gotchas.