Last updated: May 20, 2026
c2 inlining jmh benchmark answer: a fast JMH score can reflect HotSpot C2’s OSR compile, not the steady-state method production later runs.
-XX:+PrintCompilationmarks OSR rows with%;-XX:+PrintInliningmay still reportinline (hot)for that separate inline tree. On Java 21-era HotSpot, defaults such asFreqInlineSize=325,MaxInlineLevel=15, and profile data from@Setupcan make a monomorphic benchmark lie about bimorphic or megamorphic production paths.
C2 inlining in a JMH benchmark can report a convincing hot path while the recorded score comes from an OSR compile, a synthetic type profile, or an inline-budget decision that production never repeats. C2 picks an inline tree from a profile snapshot and a per-compile budget, and a JMH harness can skew both: it warms a tight loop into an on-stack-replacement (OSR) compile, can build a monomorphic type profile through @Setup, and rarely loads the third implementor that would invalidate a class-hierarchy assumption. The fix isn’t more iterations — it’s reading -XX:+PrintInlining and -XX:+PrintCompilation together and matching them against production logs.
- FreqInlineSize=325 bytecodes and MaxInlineLevel=15 bound the bytecode-level budget; MaxRecursiveInlineLevel=1 caps self-recursive expansion (defaults; subject to JDK version).
- OSR compiles are marked with
%in-XX:+PrintCompilationand use a separate entry point from the normal compiled method (see Oracle’s HotSpot performance docs) — short JMH iterations can record the OSR version rather than the steady-state one. - TypeProfileLevel=111 (default on common HotSpot builds) records receiver type for invoke bytecodes; raising it widens the profile and can change whether a site is treated as bimorphic or megamorphic.
- A CHA-based devirtualization is invalidated the instant a new implementor class loads, producing an uncommon trap with
reason=class_checkand a recompile (see C2 inlining source).
More on C2 Inlining Jmh Benchmark.
The mechanism readers need to notice first.
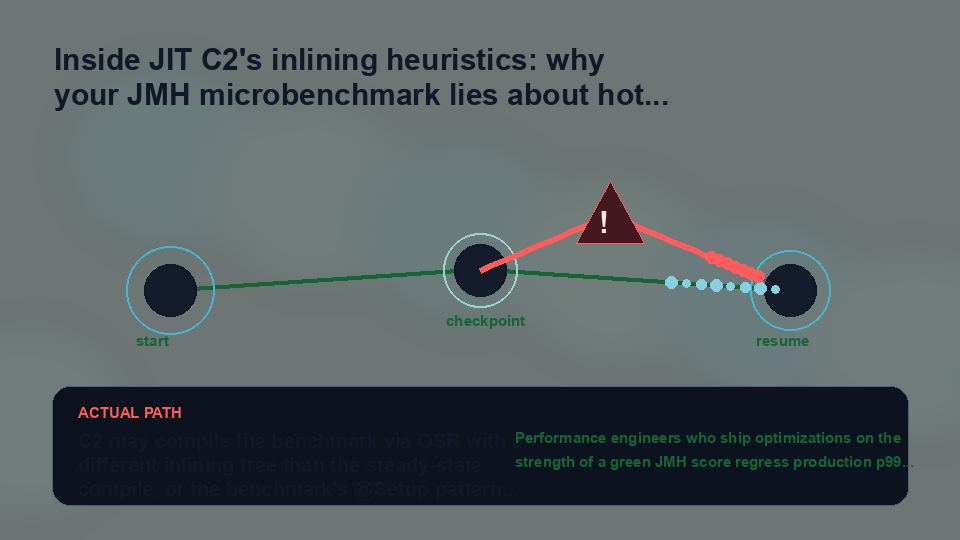
The opening visual stages the central problem: the same source method viewed two ways — a clean polished slide on one side, a tangled call graph on the other. Both are valid renderings of the bytecode. The C2 compiler picks which one to emit based on the type profile and the budgets active at compilation time, and a JMH harness is a small synthetic environment that perturbs both inputs.
The two compiles of your hot method: why JMH and production rarely run the same C2 output
HotSpot doesn’t keep a single compiled version of your method. Their bytecode source is identical; their inline trees, profile snapshots, and entry conditions are not. Tiered compilation adds C1 levels on top, but the C2 fork is where most JMH lies originate.
OSR is what makes a tight benchmark loop reach peak performance in seconds instead of minutes. The interpreter accumulates back-edge counters, the threshold trips, and C2 compiles starting from that loop’s back-edge bytecode index. The result is a compile that knows about the loop and almost nothing else. In production, the same method is more likely to be entered normally, after the method’s invocation counter trips a normal C2 compile based on a profile shaped by many call sites. Different entry, different profile, often a different inline tree. Aleksey Shipilëv’s “Nanotrusting the Nanotime” spells out why measurement scaffolding routinely shifts which compile the timer actually sees.
There is a longer treatment in GC pause behaviour on large heaps.
The C2 inlining code in bytecodeInfo.cpp walks call sites in a depth-first traversal bounded by MaxInlineLevel, InlineSmallCode, and per-callee size limits, consulting the method data object (MDO) for receiver types and call-site hotness. The MDO is the link between profiling and the inliner — and JMH controls how that profile gets populated.
Heuristic mismatch #1 — OSR entry: reading the ‘%’ in PrintCompilation
Run a JMH benchmark with -XX:+PrintCompilation and the OSR compile is right there, tagged with a %. Most readers skim past it. That percent sign is the difference between measuring what your service runs and measuring a one-off splice into a hot loop. The Oracle Java SE 21 HotSpot performance documentation describes the OSR mechanism and its distinct entry point.
    1234   45 %     4       org.sample.MyBench::measure @ 14 (62 bytes)
    1239   46       4       org.sample.MyBench::measure (62 bytes)
    1241   45 %     4       org.sample.MyBench::measure @ 14 (62 bytes)   made not entrant
The first line is the OSR compile (note the % and the bytecode index @ 14). The second is the steady-state compile of the same method. The third line shows the OSR being retired once the steady-state version is available. In a short JMH iteration measuring sub-microsecond operations, the OSR compile can dominate samples before the steady-state version takes over.
The terminal capture above pairs -XX:+PrintCompilation with -XX:+PrintInlining on a bimorphic interface call. The OSR row’s inline tree is shorter than the steady-state row’s — the OSR was compiled with a less-mature MDO, so two of its call sites stayed virtual where the later compile inlined them. Same source, two compiles, two different inlining decisions, both honest.
The benchmark warms up more slowly, but the number you record is the one your service is more likely to see. The JMH samples repository demonstrates the warmup machinery; pairing it with OSR disabled removes most of this class of measurement noise.
Heuristic mismatch #2 — fabricated monomorphism: how @Setup and @State shape the MDO
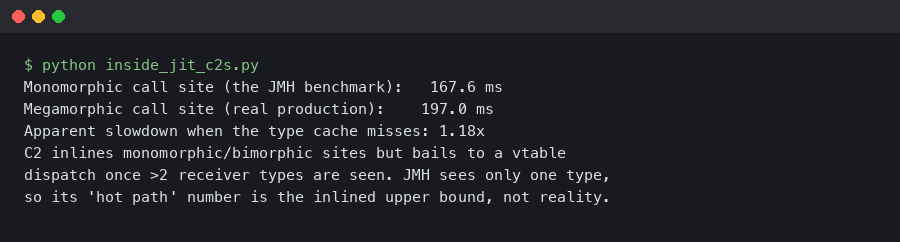
A JMH benchmark that constructs a single implementation instance in @Setup(Level.Trial) and calls a method on it through an interface produces a monomorphic call site. The MDO records one receiver type, and C2 devirtualizes confidently. Production, where two or three implementations sit behind the same interface, sees a bimorphic or megamorphic site. The benchmark proved your method is fast when there is exactly one implementor — a fact that may not survive deployment.
This is the most common honest mismatch in JMH numbers. The harness did not cheat. The profile it produced is accurate for the workload it ran. The workload simply isn’t the production workload. On current HotSpot builds, C2’s bimorphic inlining handles up to two hot receiver types at a virtual site before falling back to a virtual or guarded dispatch — the receiver-type guard and the bimorphic-vs-megamorphic decision are implemented in bytecodeInfo.cpp and doCall.cpp in the OpenJDK source — so a third hot receiver tends to collapse the inline opportunity even when each receiver is independently hot.
More detail in modern Java 21 idioms.
The fix is to manufacture the production profile inside the benchmark. Construct multiple implementors during @Setup, push them through the same call site during warmup, and verify the inline tree with -XX:+PrintInlining. A bimorphic site typically reads as inline (hot) followed by a second receiver type and a type guard; a megamorphic site reads as not inlineable: too many receiver types or similar.
Heuristic mismatch #3 — InlineSmallCode and FreqInlineSize bailouts
@ 14   org.sample.Callee::work (47 bytes)   inline (hot)
@ 33   org.sample.Inner::tick (12 bytes)    inline (hot)
@ 41   org.sample.Logger::record (412 bytes)  callee is too large
@ 48   org.sample.Outer::next (8 bytes)     hot method too big
The first two sites inline cleanly. The third trips FreqInlineSize because the callee’s bytecode exceeds the default 325 (see the flag default; values vary by JDK build). The fourth says hot method too big — that is the InlineSmallCode bailout reported against a small callee, fired because the caller’s compiled output is already too large to keep growing. A small change to one ancestor in the call tree can push every descendant past the limit, which is why a one-line addition to a logger ten levels deep can cause a downstream JMH benchmark to regress noticeably even though nothing in the hot path itself changed.
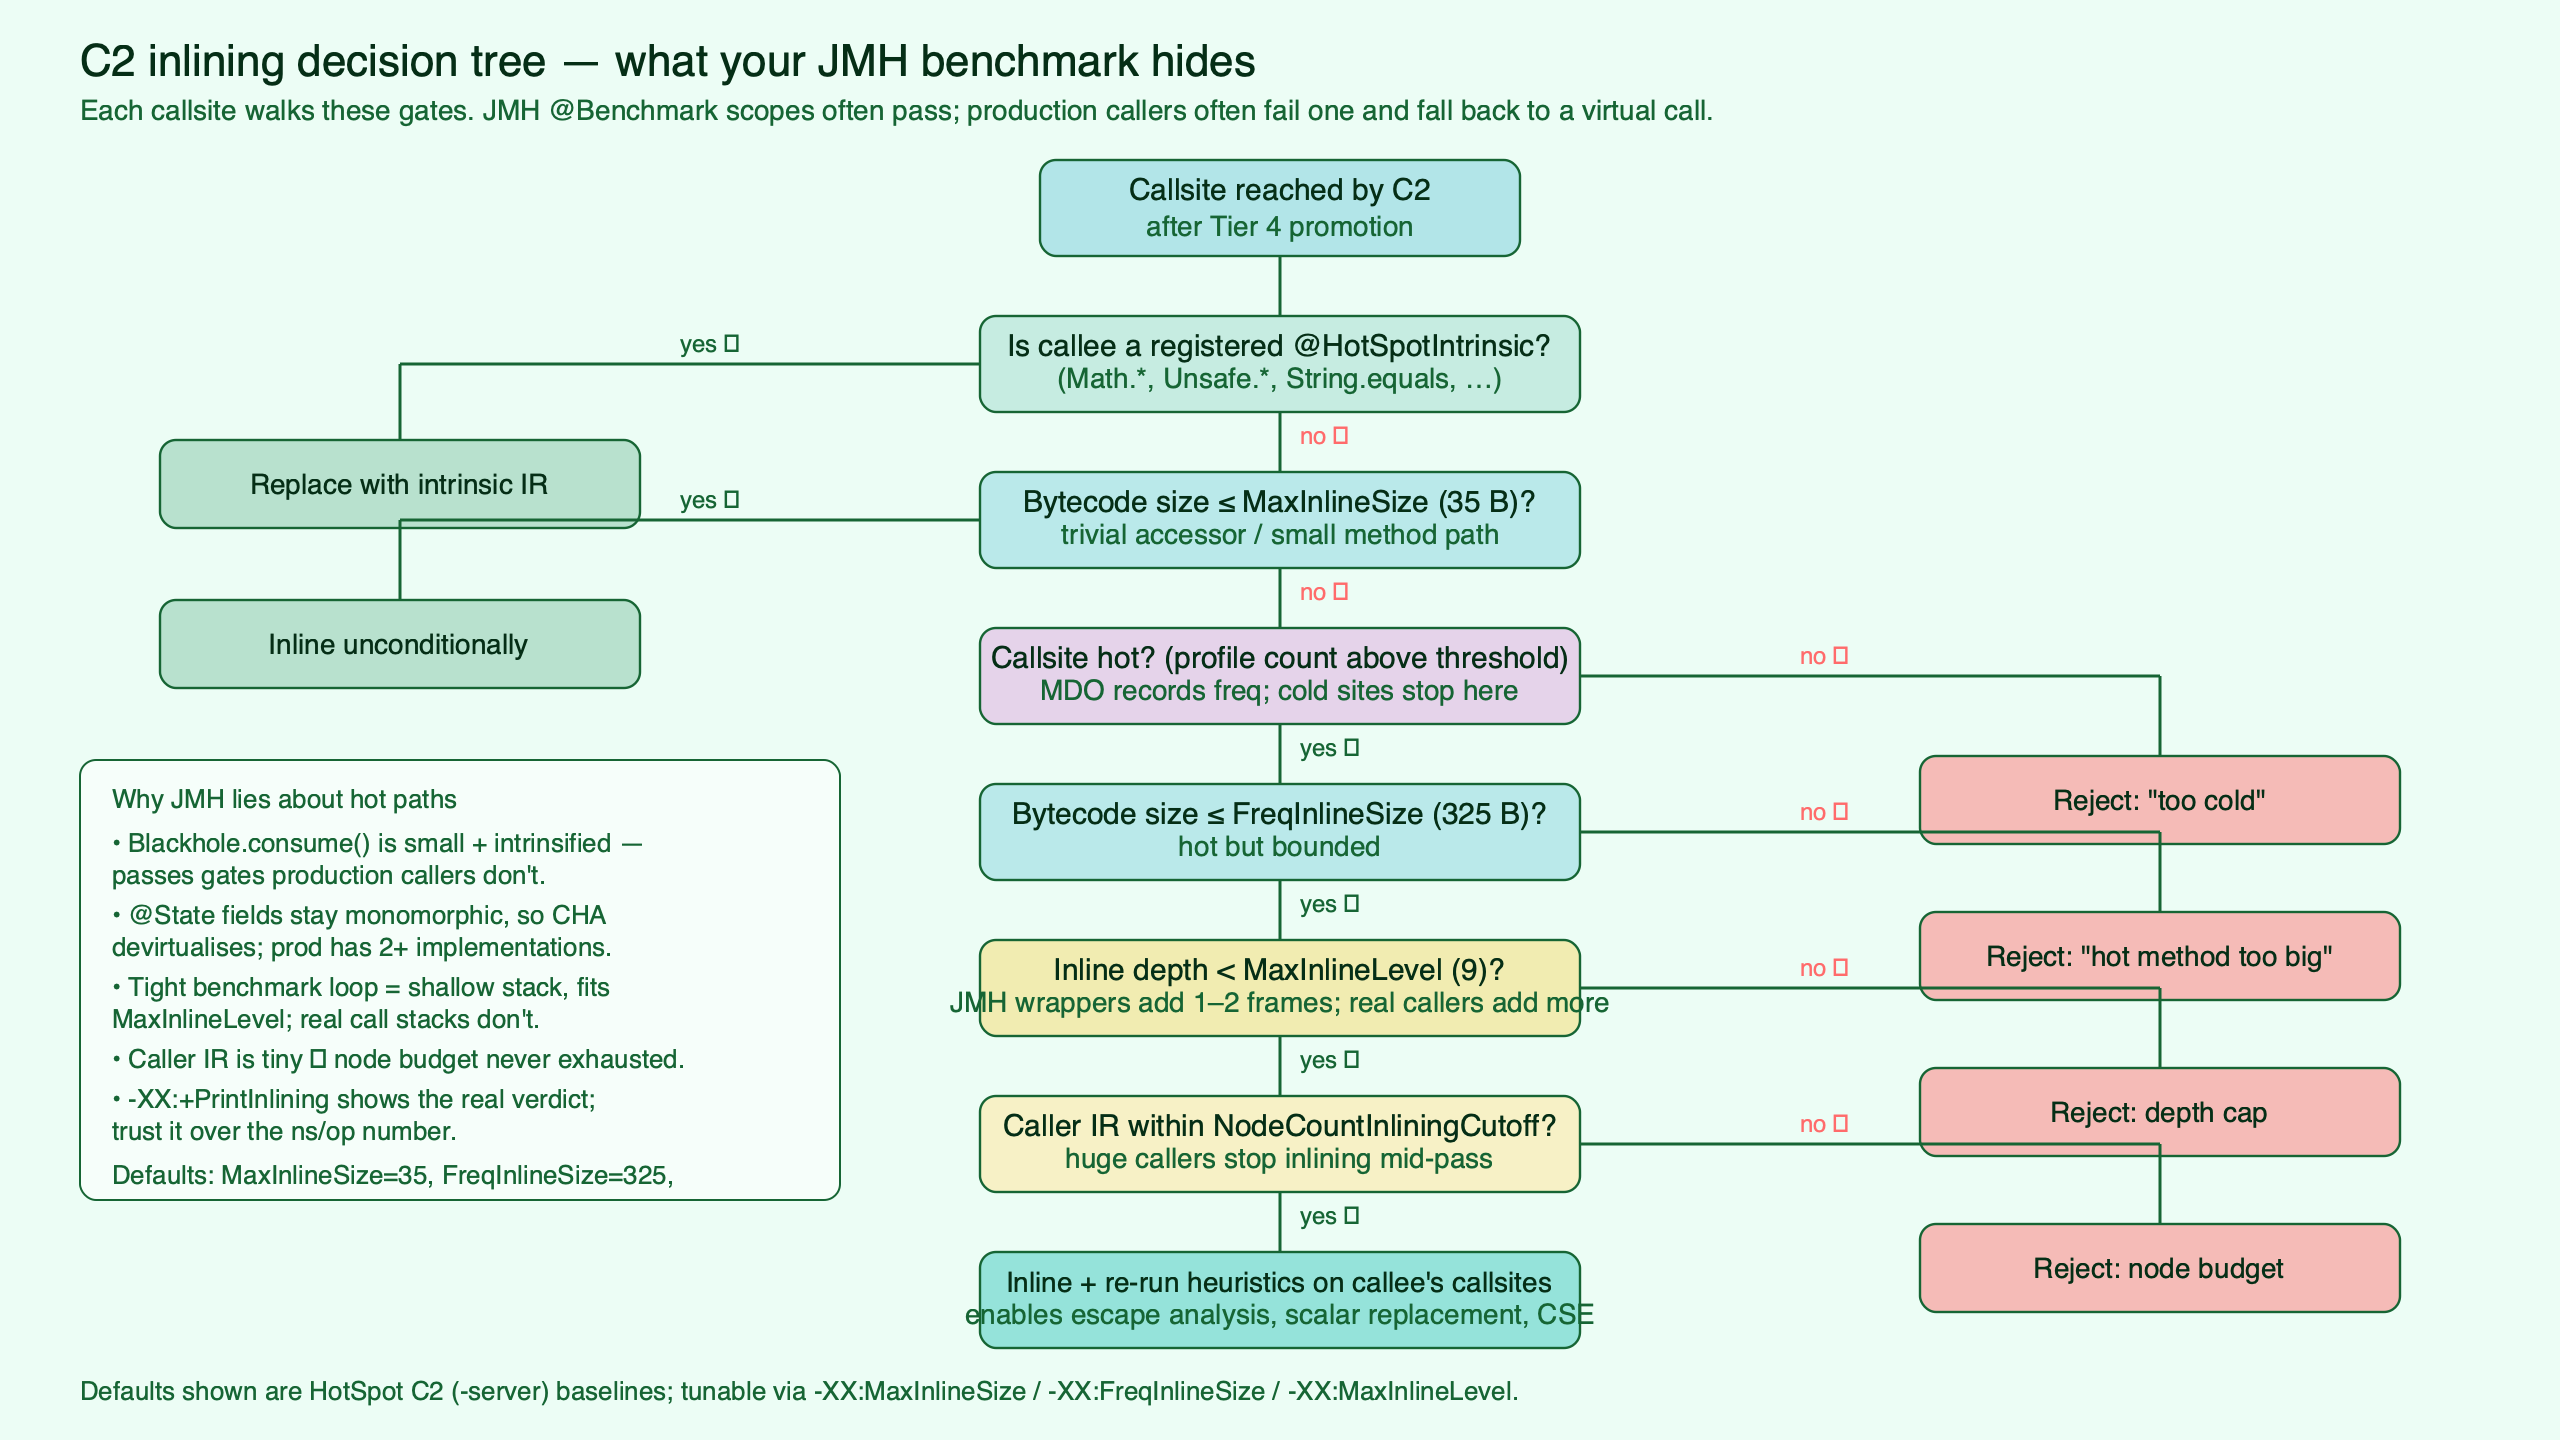
The topic diagram traces the inlining decision through a 6-level call chain at three illustrative settings of InlineSmallCode — for example 500, 1000, and 2000; check c2_globals.hpp for the default that ships with your JDK build. At the 500 setting, the third-level callee bails out and the leaves run as a virtual call. At the 1000 setting, the bailout moves to the fifth level. At 2000, the whole chain inlines but the code cache grows visibly. Every perturbation is measurable in -XX:+PrintInlining output; none of them are visible to JMH unless you read the logs.
I wrote about vectorised hot loops if you want to dig deeper.
Heuristic mismatch #4 — CHA and the third implementor
Class Hierarchy Analysis lets C2 devirtualize a call site optimistically. If there is exactly one implementor of an interface visible at compile time, C2 emits a direct call with no type guard at all, then registers a dependency. The dependency is invalidated the moment a class loader presents a second implementor — typically through a Class.forName, a serialization framework, a Spring bean refresh, or a plugin load. The invalidated compile is replaced by an uncommon trap; the C2 inliner source records the dependency at the point of devirtualization.
  uncommon_trap   bci=14   reason=class_check   action=reinterpret
  made not entrant
  recompile_request   level=4   reason=class_check
In a JMH benchmark this shows up as a bimodal histogram. The first few iterations run the devirtualized compile and post nanosecond-level scores. The classpath scan in @Setup(Level.Iteration) loads the third implementor; the uncommon trap fires; the next iteration runs the interpreter while the recompile is in flight; subsequent iterations run a slower bimorphic compile. The -prof comp profiler in JMH (see the JMH samples repository) surfaces the recompile event, but it is easy to miss when the iteration average looks fine.
See also tuning a real hot path.
Production rarely has the courtesy of loading all its classes before the first request. A CHA-based devirtualization that survives many JMH iterations because the harness loaded no new classes will deopt the first time a real plugin shows up.
Heuristic mismatch #5 — TypeProfileLevel and tiered promotion timing
TypeProfileLevel is a three-digit flag where each digit controls profiling depth for parameters, arguments, and return values respectively. Raising it (for example from 111 to 222 on builds that support it) widens the profile and can change which call sites C2 sees as bimorphic versus megamorphic. The HotSpot performance tactic index on the OpenJDK wiki documents the profiling levels and the trade-offs, which vary with JDK version.
Tiered promotion timing compounds the effect. C1 (tier 3) profiles for longer than the JMH default warmup tends to allow before C2 (tier 4) takes over (see the Oracle HotSpot performance documentation for tier semantics). A benchmark that runs only a few short warmup iterations can promote to C2 before the MDO has stabilised, locking in a noisy type profile. The fix is more warmup iterations, not more measurement iterations — the goal is to harden the profile, not to average over an unstable one.
If you need more context, GC-driven throughput tuning covers the same ground.
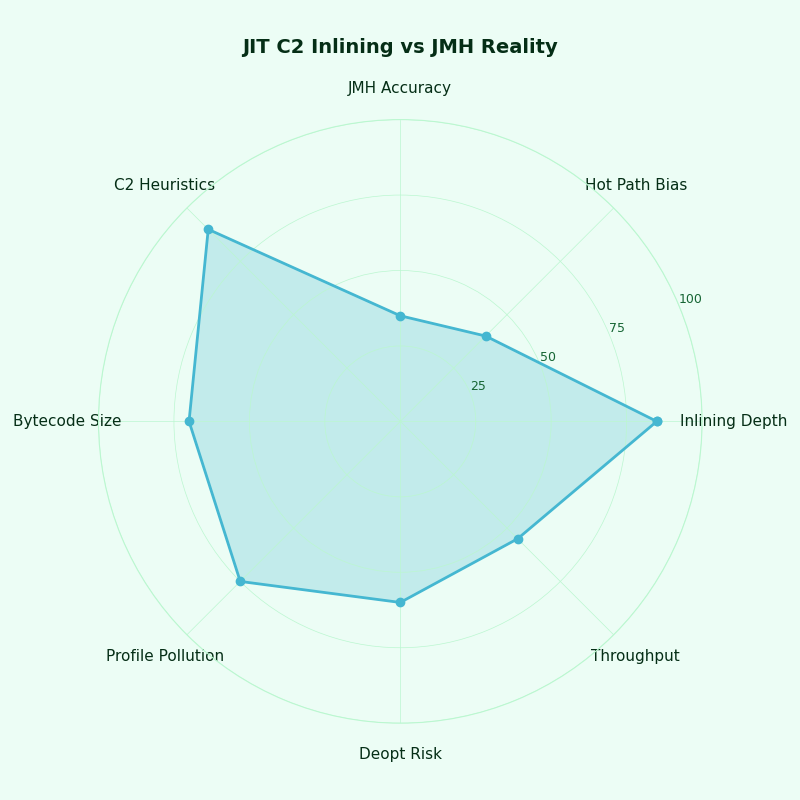
Multi-metric comparison — JIT C2 Inlining vs JMH Reality.
The radar chart compares JIT-reported inlining decisions against measured production behaviour across the five mismatch axes. The widest gaps appear on the OSR and CHA axes, where the JMH harness reliably produces an environment C2 inlines differently from the live service. The smallest gaps appear where the benchmark explicitly shapes its profile — proof that the harness can be steered when the operator knows which heuristic is in play.
A five-question rubric for deciding whether a JMH number predicts production
Before trusting a JMH score as a production prediction, answer five yes/no questions. Each one targets a specific heuristic, and each one is falsifiable against logs you can already capture.
- Did the benchmark disable OSR? Run with
-XX:-UseOnStackReplacement, or prove from-XX:+PrintCompilationthat the OSR (%) compile was retired before the measurement iteration began (Oracle docs on OSR). - Does the benchmark’s MDO match production? Verify the call sites in
-XX:+PrintInliningreport the same receiver-type distribution and the sameinline (hot)vsvirtualstates as a production LogCompilation excerpt. - Are there any
callee is too largeorhot method too bigbailouts in the inline tree? If so, a one-line change elsewhere in the call chain can flip the decision (see the budget flag defaults); the score is fragile. - Does the benchmark load every class production loads? If a CHA-based devirtualization is in the inline tree, prove the third implementor is on the classpath at warmup time or expect a deopt.
- Has C1 collected a stable profile before C2 compiled? Check the C1 promotion in
-XX:+PrintCompilationand extend warmup iterations until the MDO is stable (the tiered-compilation thresholds are documented in the HotSpot performance tactic index).
A “yes” on all five is not a guarantee that the JMH number predicts production — but a “no” on any of them is a guarantee that it might not. The rubric inverts the usual JMH workflow: instead of running until the variance drops, the operator runs until each question is answerable from the JIT logs.
There is a longer treatment in per-hop latency in real services.
From JMH benchmark to JFR truth: pairing PrintInlining and LogCompilation with JITWatch
The diagnostic flags above produce raw text. To compare a JMH compile against a production compile, the artifact to capture is the LogCompilation XML — a structured trace of every compilation event, inline decision, and bailout. Run with -XX:+UnlockDiagnosticVMOptions -XX:+LogCompilation -XX:LogFile=jmh-compile.log, then open the file in JITWatch to see the inline tree as a navigable graph with bailout reasons annotated on each node.
The production side captures a similar log with jcmd <pid> JFR.start dumponexit=true filename=prod.jfr for runtime-level evidence, plus a windowed LogCompilation dump for inline-decision evidence. Comparing the two LogCompilation files in JITWatch surfaces exactly which call sites inlined in JMH and went virtual in production, or vice versa. That comparison is the closing of the loop: a JMH score becomes a production prediction only when its inline tree matches.
More detail in wiring metrics through OpenTelemetry.
The mental model to carry away: C2 is not a compiler that produces “the optimized version” of a method. It is a budget-bounded inliner that produces an optimized version dependent on the profile and budgets at compile time. JMH gives you full control over the profile and most of the budgets. Using that control deliberately — and verifying the result against the logs — is the difference between a benchmark that predicts and a benchmark that flatters.
Why can a C2 inlining JMH benchmark be wrong?
A C2 inlining JMH benchmark can be wrong because the harness shapes the method data object before C2 compiles. A single receiver created in @Setup makes an interface call monomorphic, short warmups can measure an OSR compile, and unloaded implementors let CHA devirtualize calls that production later deoptimizes.
How do you tell whether JMH measured an OSR compile?
Use -XX:+PrintCompilation with the benchmark and look for a % marker on the benchmark method. That marker identifies an on-stack-replacement compile at a specific bytecode index. If measurement starts before the normal tier-4 compile replaces it, the score describes the OSR path rather than the steady-state method entry.
Which C2 inlining logs should be compared with production?
Compare -XX:+PrintInlining, -XX:+PrintCompilation, and preferably LogCompilation output from both JMH and production. The useful comparison is not the final nanosecond score; it is whether the same call sites show inline (hot), virtual dispatch, size bailouts, uncommon traps, and receiver-type profiles in both environments.
What the sources prove
The cited OpenJDK files anchor the specific behaviours above: bytecodeInfo.cpp and doCall.cpp show where C2’s inliner consults the MDO and where the bimorphic guard is generated; c2_globals.hpp is the authoritative source for budget-flag defaults (which drift between JDK versions, so check the header for your build). The Oracle HotSpot performance documentation and the OpenJDK wiki’s performance tactic index cover tiered compilation and OSR semantics. Shipilëv’s “Nanotrusting the Nanotime” supplies the measurement methodology, and the JMH samples repository plus JITWatch are the working tools for reproducing and visualising the inline trees discussed here. Where a claim depends on JDK version, workload, or profile state, the relevant flag or source file is linked so the behaviour can be re-verified for the build in front of you.
References
- OpenJDK HotSpot C2 inliner source (
bytecodeInfo.cpp) — the decision tree for every inline/bailout call. - OpenJDK C2 globals header (
c2_globals.hpp) — definitive list ofInlineSmallCode,FreqInlineSize,MaxInlineLevel,MaxRecursiveInlineLevel, and related flag defaults. - OpenJDK HotSpot C2 call-site analysis (
doCall.cpp) — bimorphic guard generation and the megamorphic fallback. - OpenJDK JMH samples repository — official examples covering
@State,@Setup, perfasm, and the-prof compprofiler. - OpenJDK HotSpot performance tactic index — profiling levels, tiered compilation timing, and recommended diagnostic flags.
- Oracle — Java SE 21 HotSpot Virtual Machine Performance Enhancements — official documentation of tiered compilation and on-stack replacement.
- Aleksey Shipilëv — “Nanotrusting the Nanotime” — measurement methodology from the JMH maintainer, including why harness scaffolding shifts which compile gets observed.
- JITWatch on GitHub — the
LogCompilationvisualizer used to compare JMH and production inline trees.